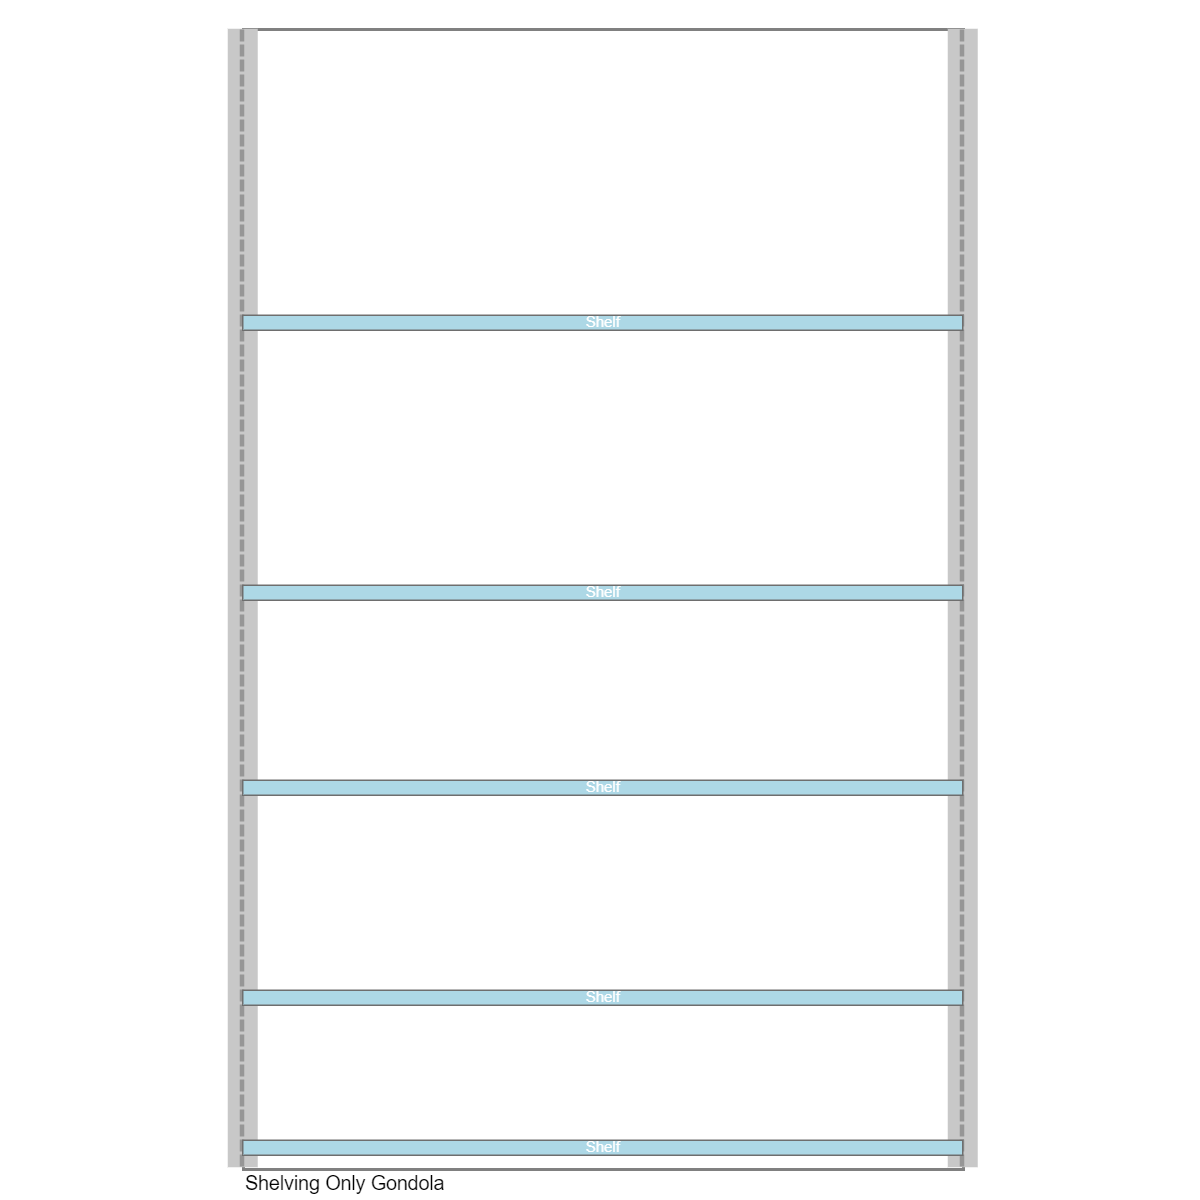
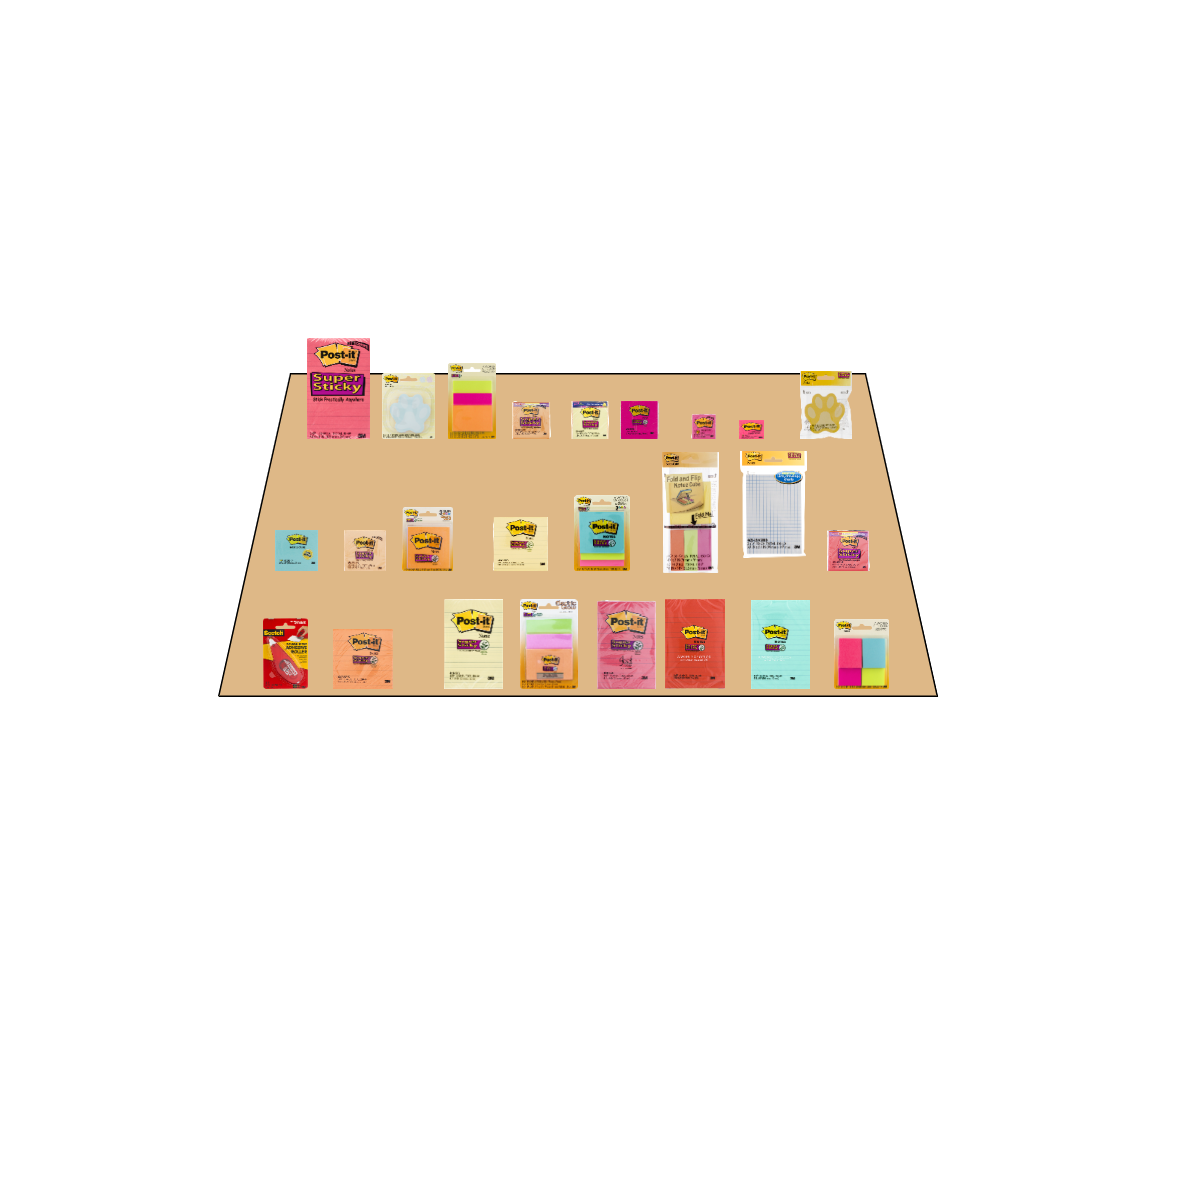
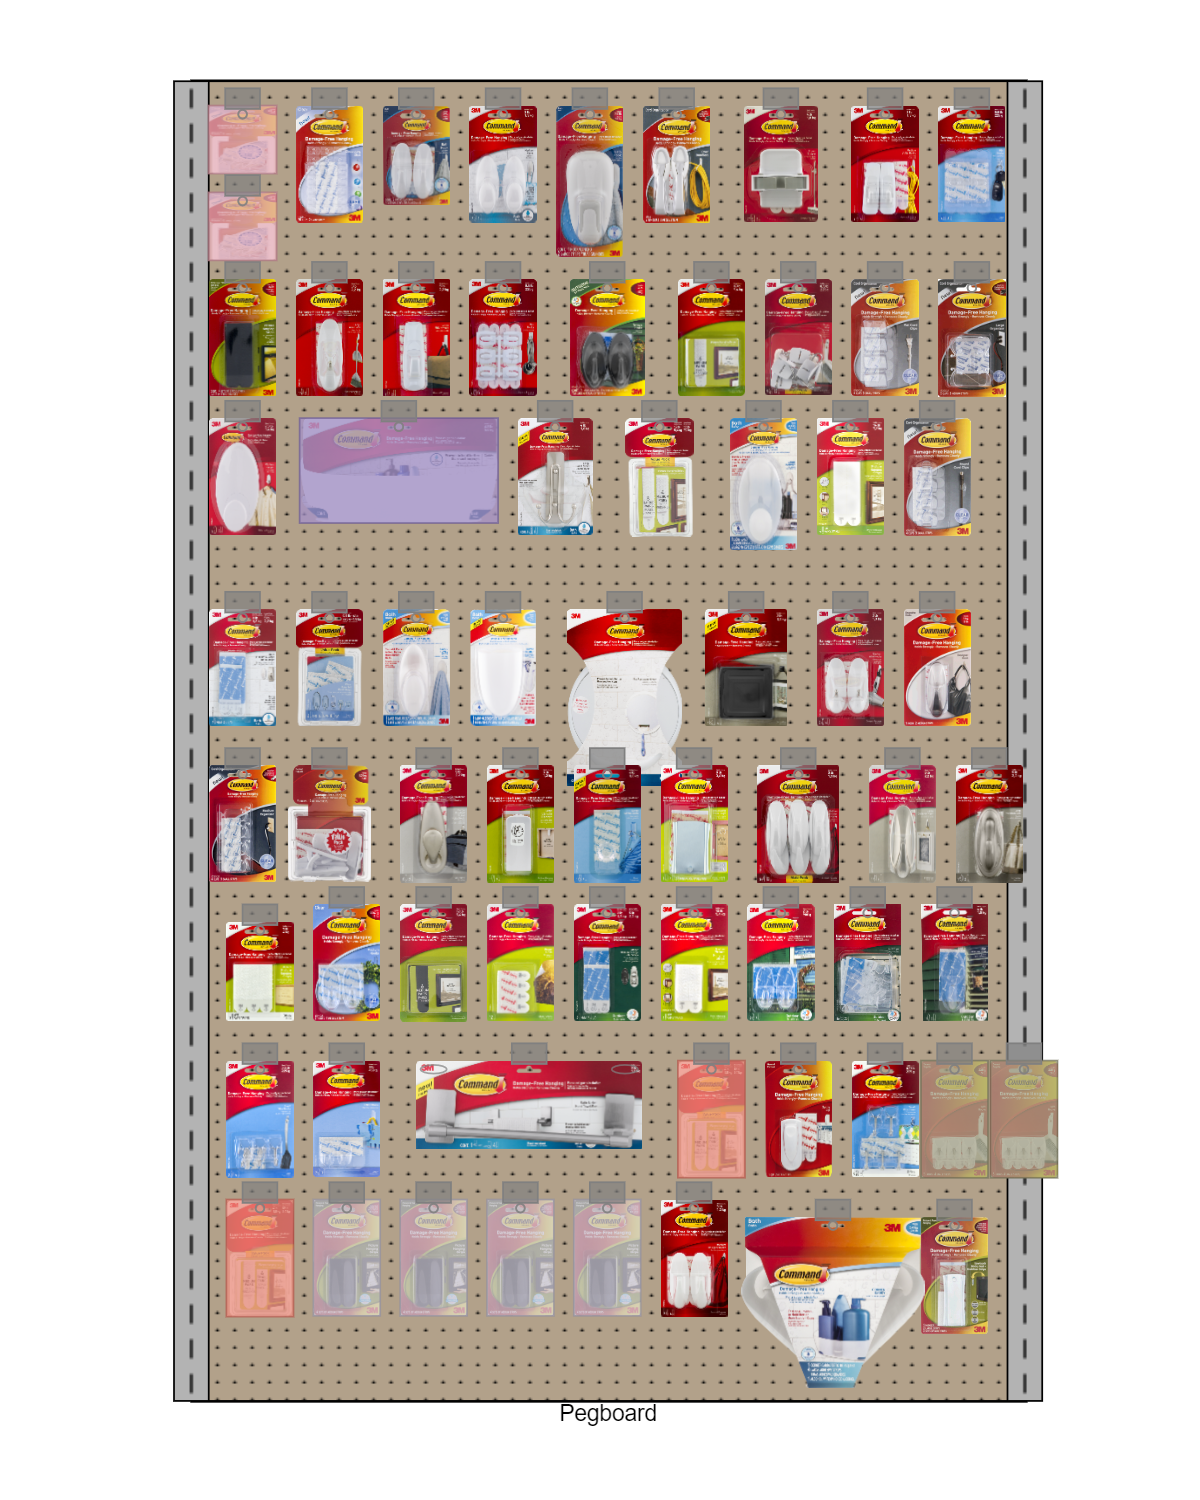
Customize, position, rotate, annotate, and label gondolas in a top-down view to plan your entire space, optimize adjacencies, and assist in category management.
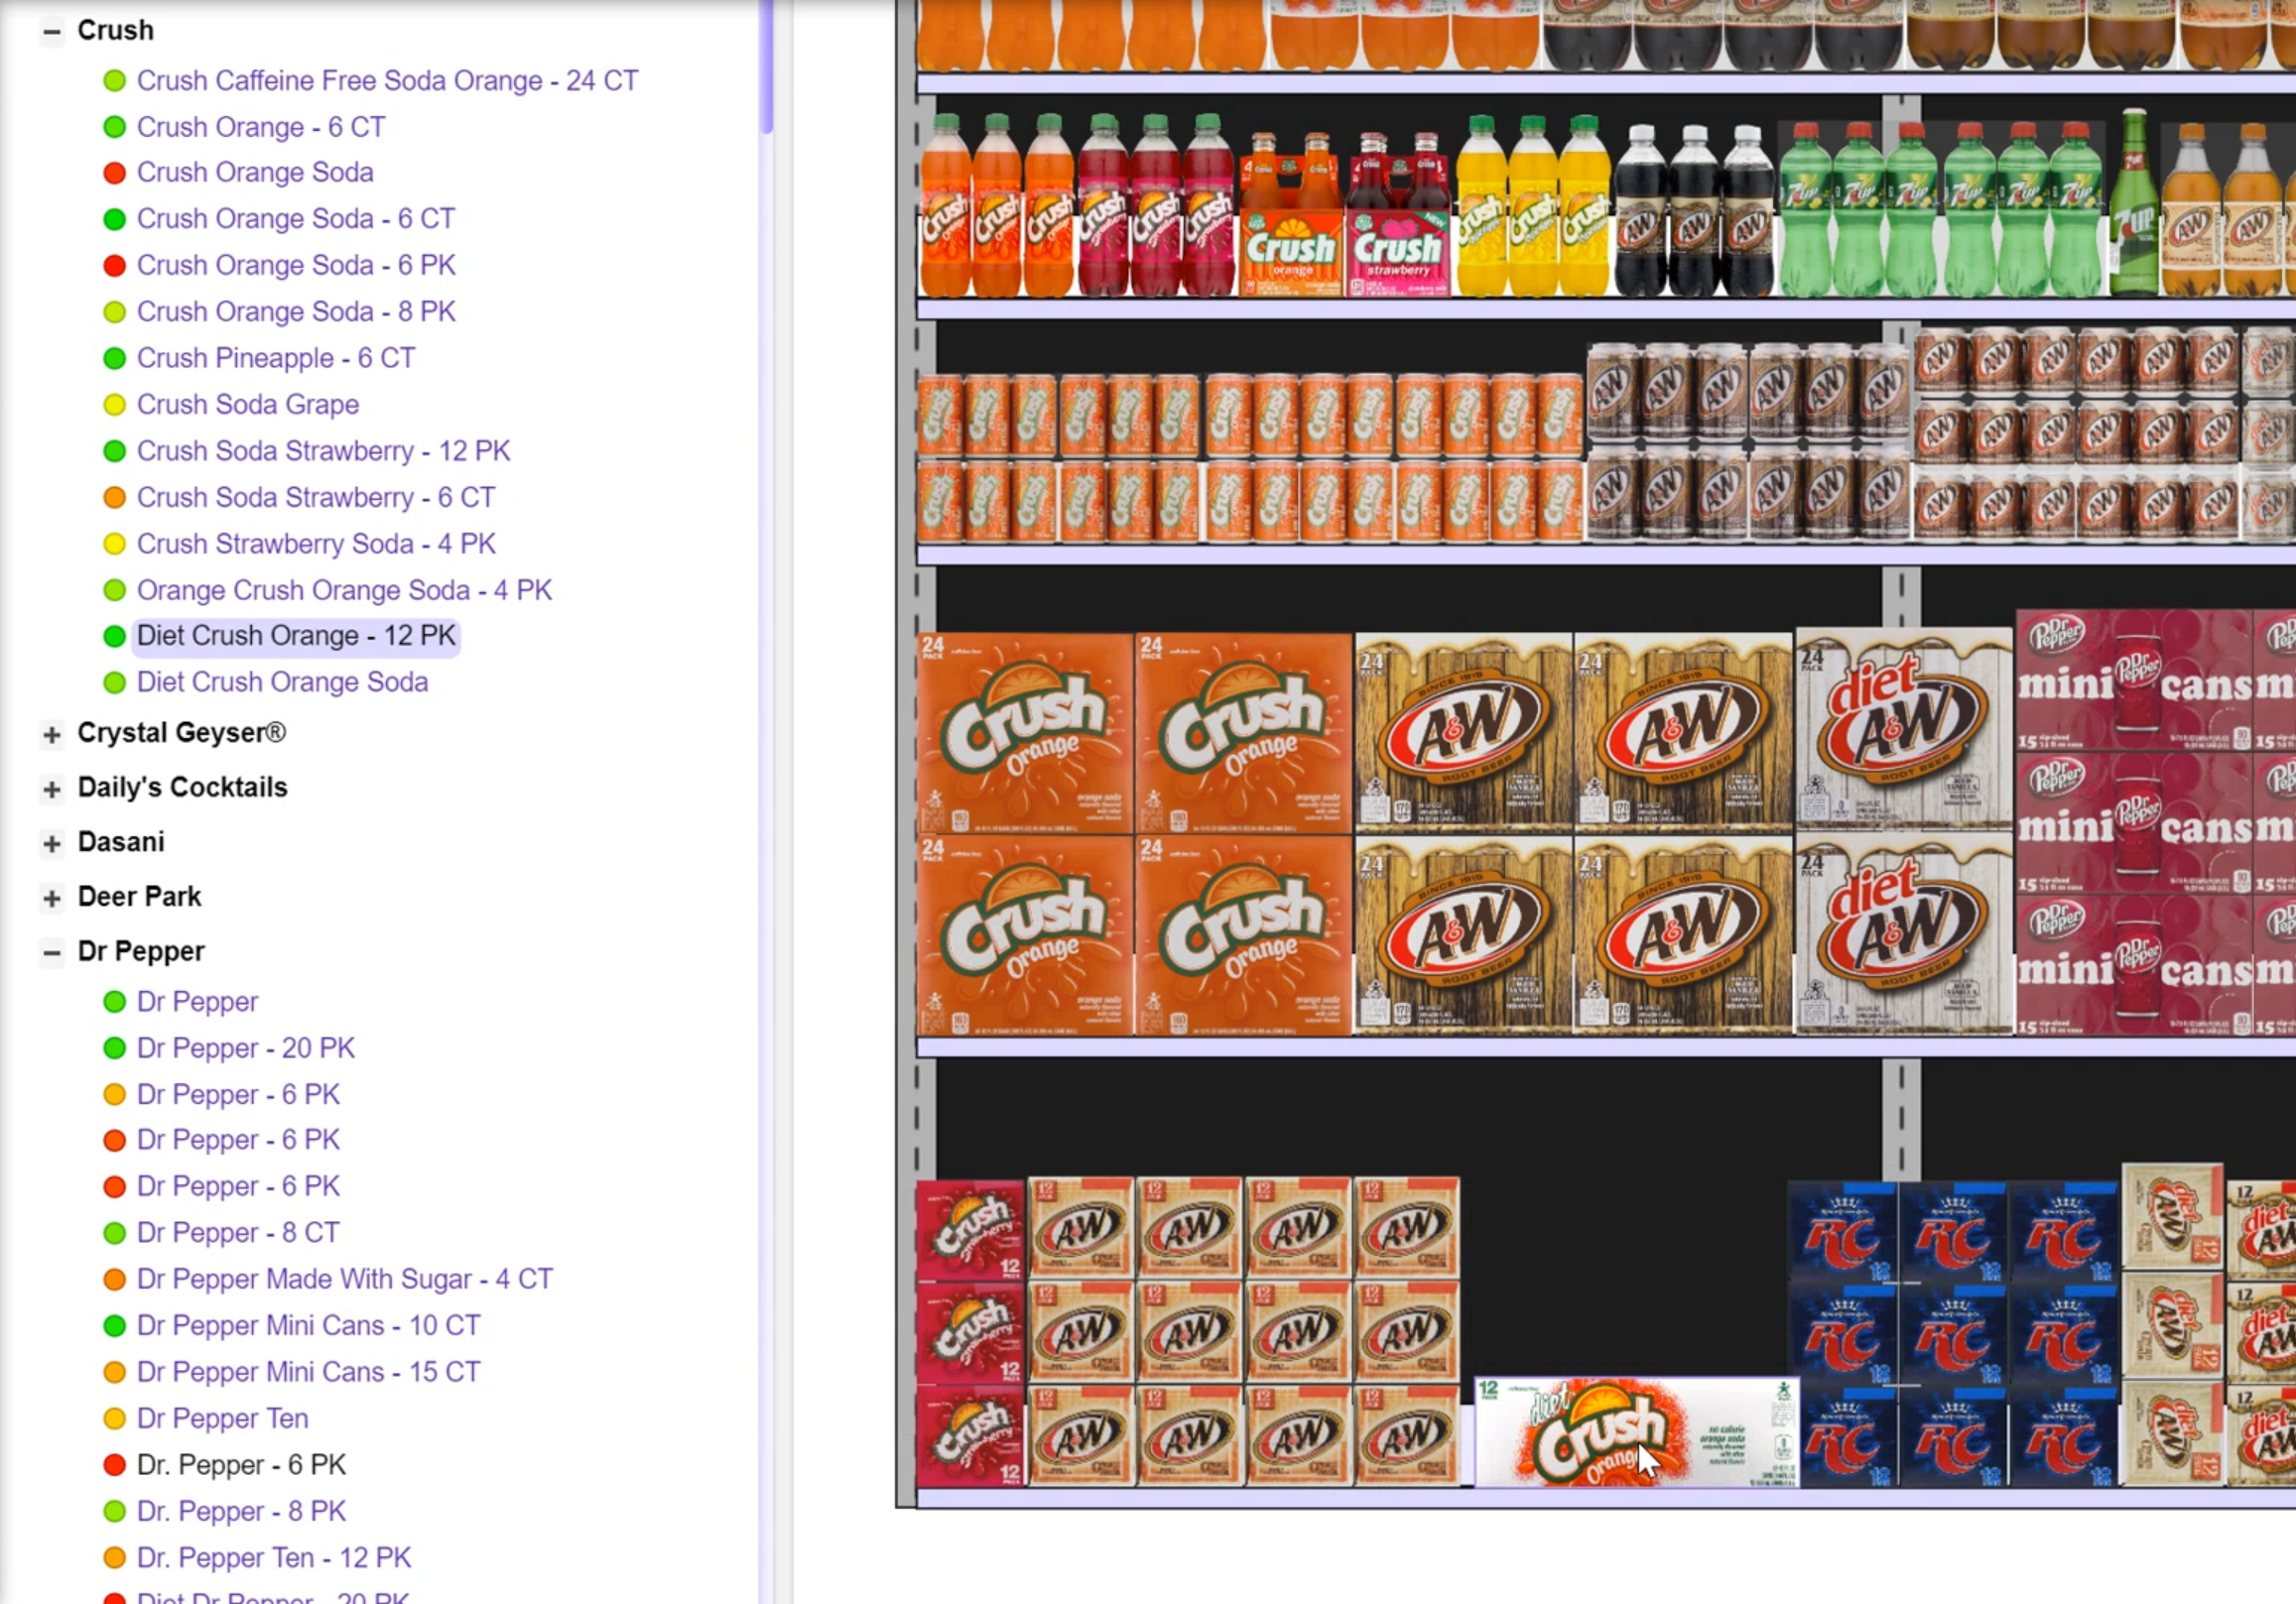
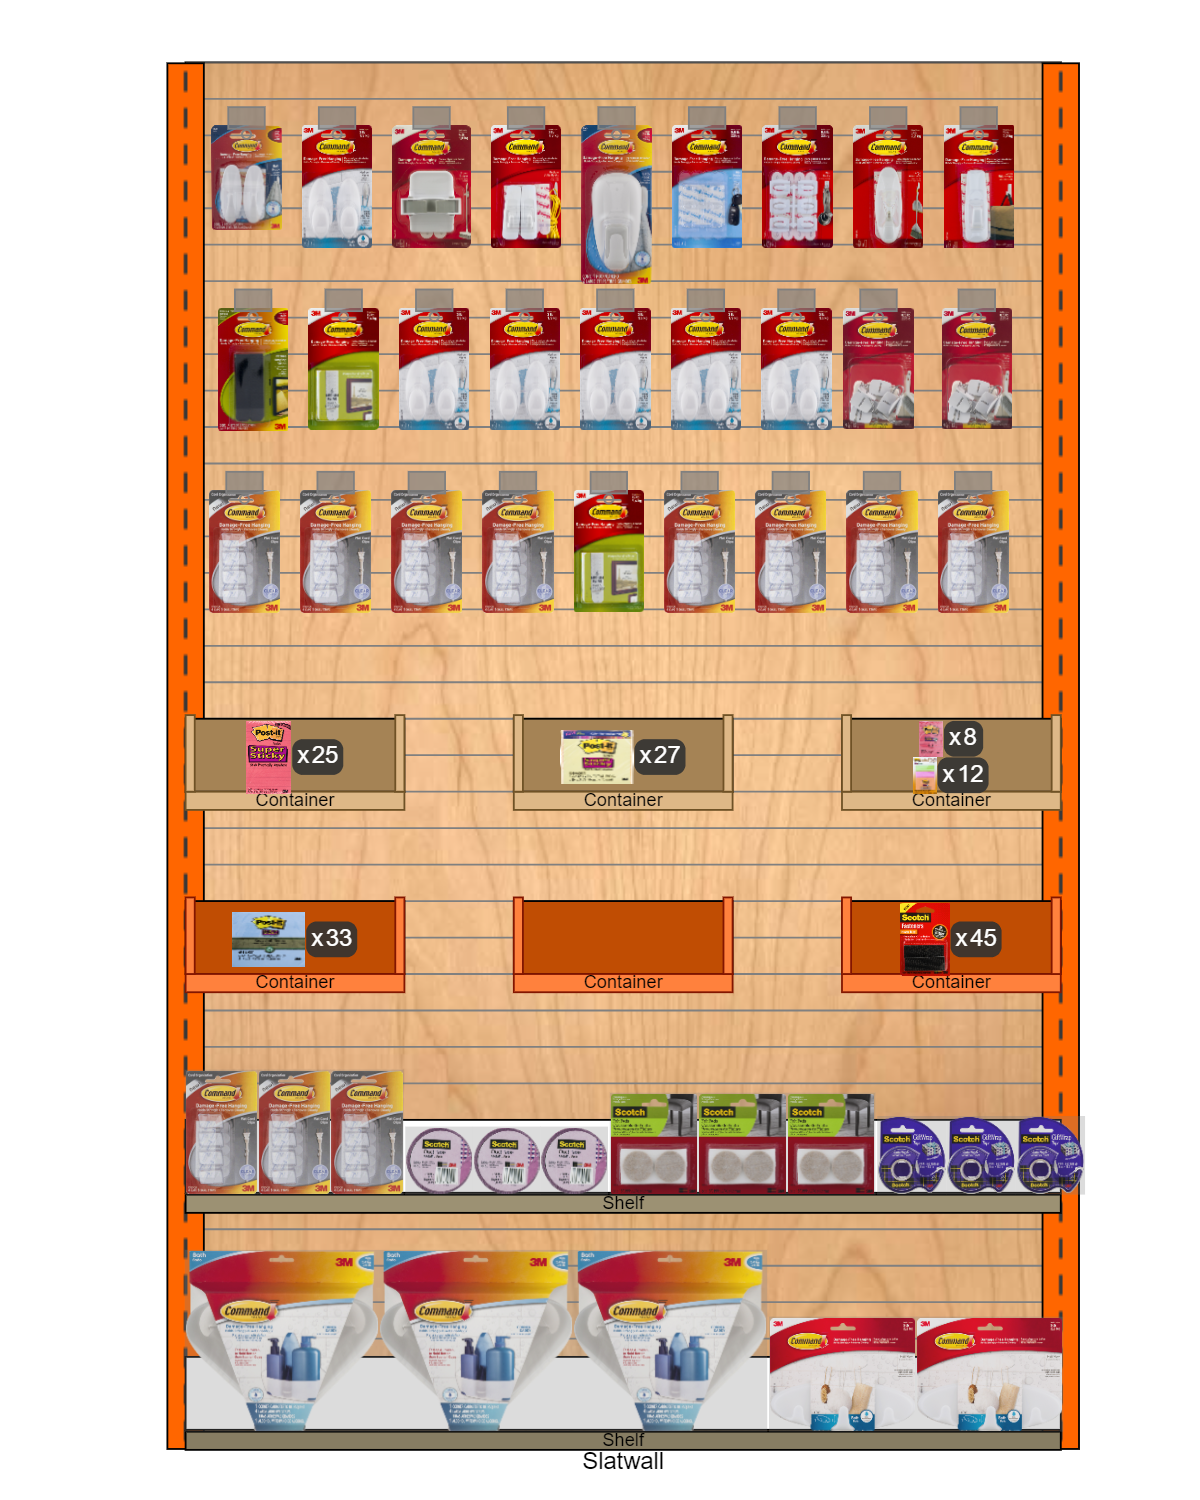
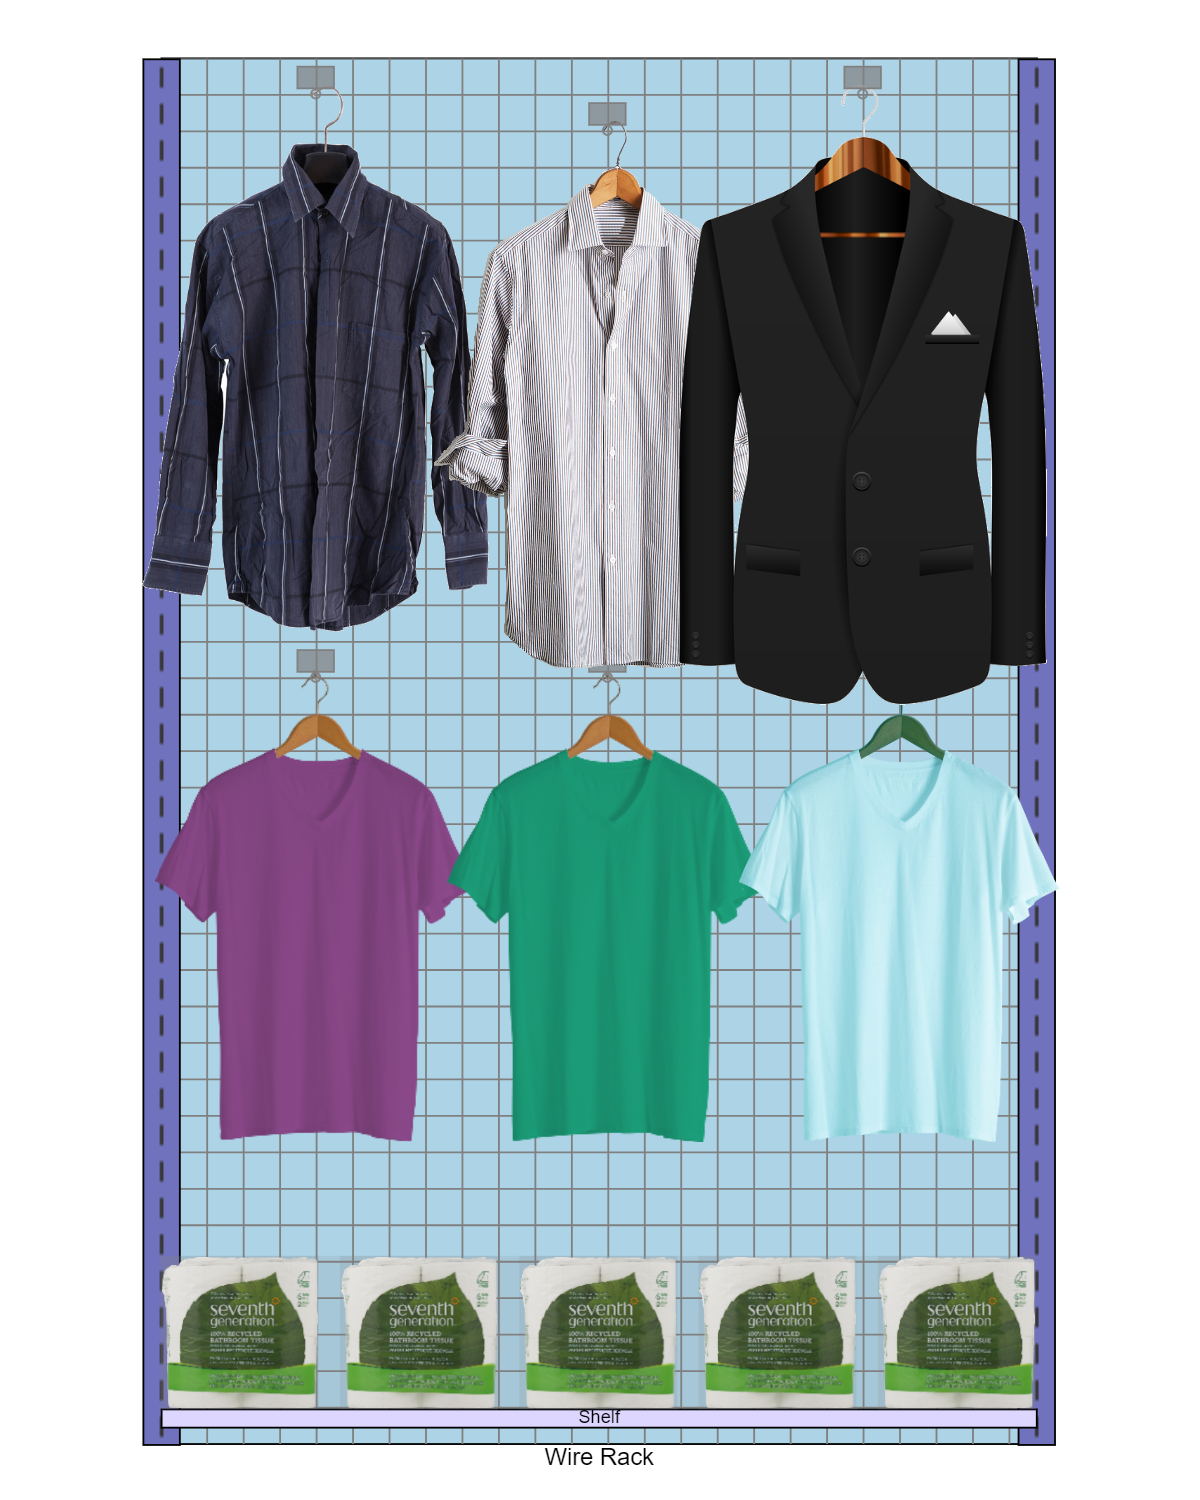
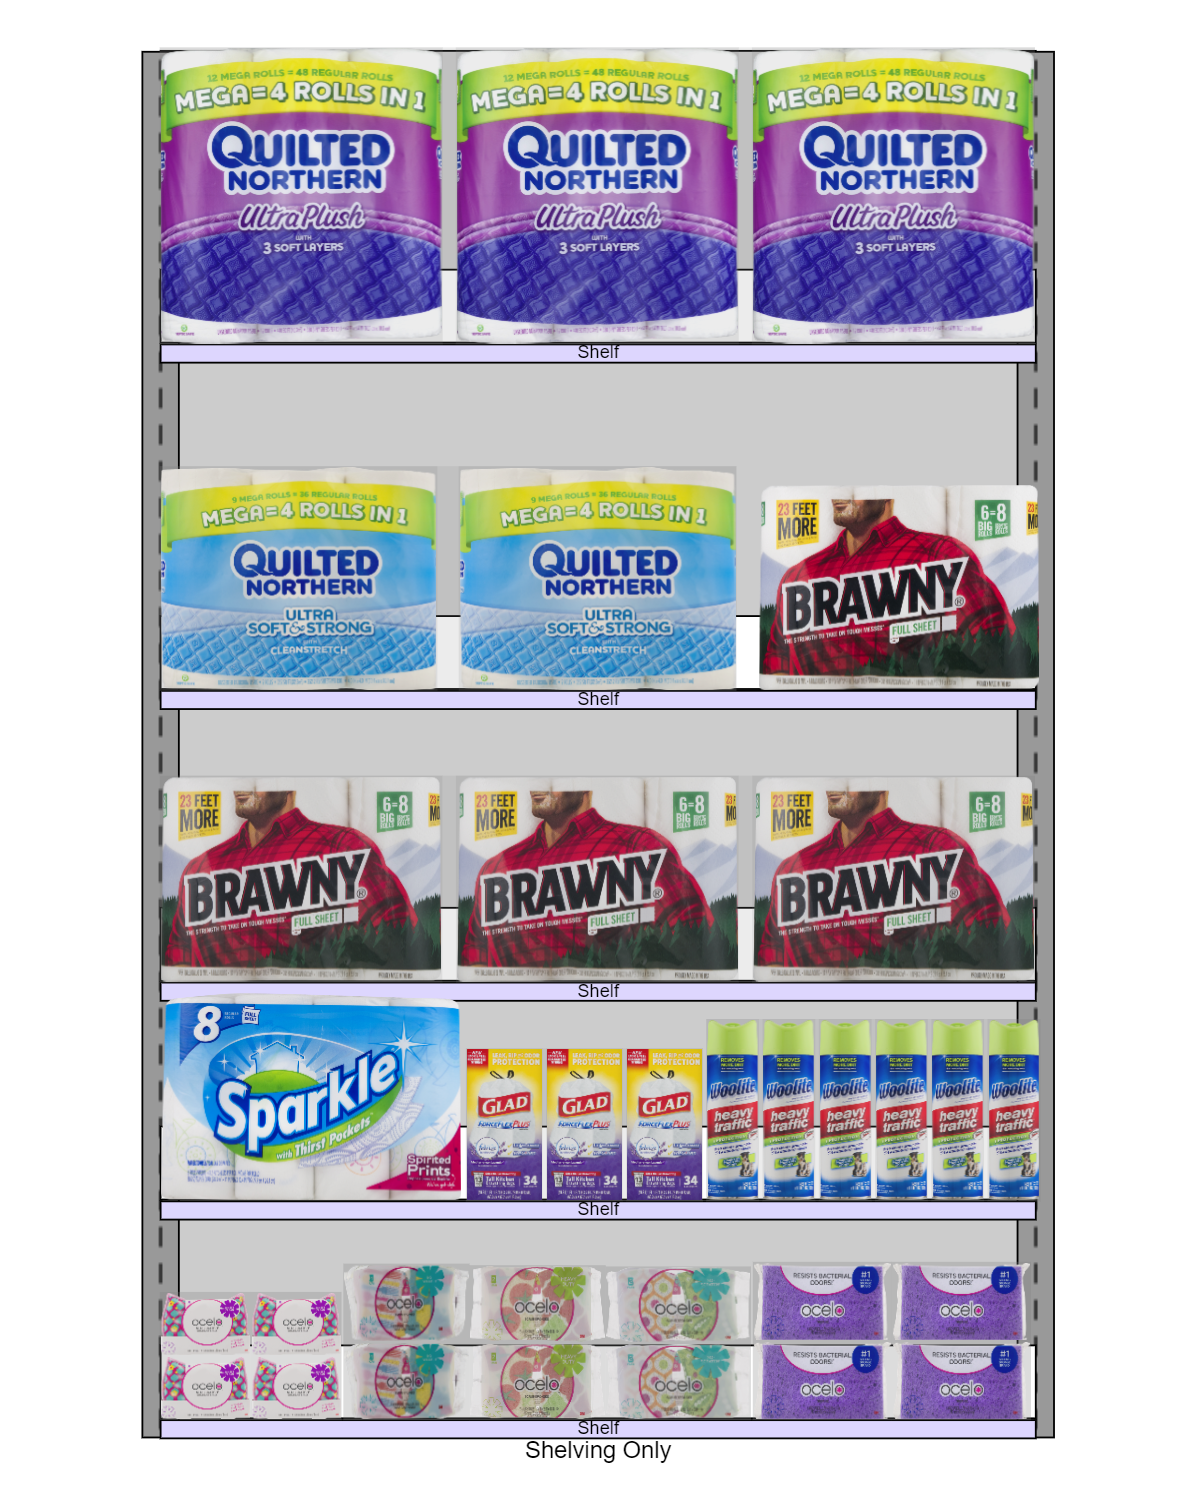
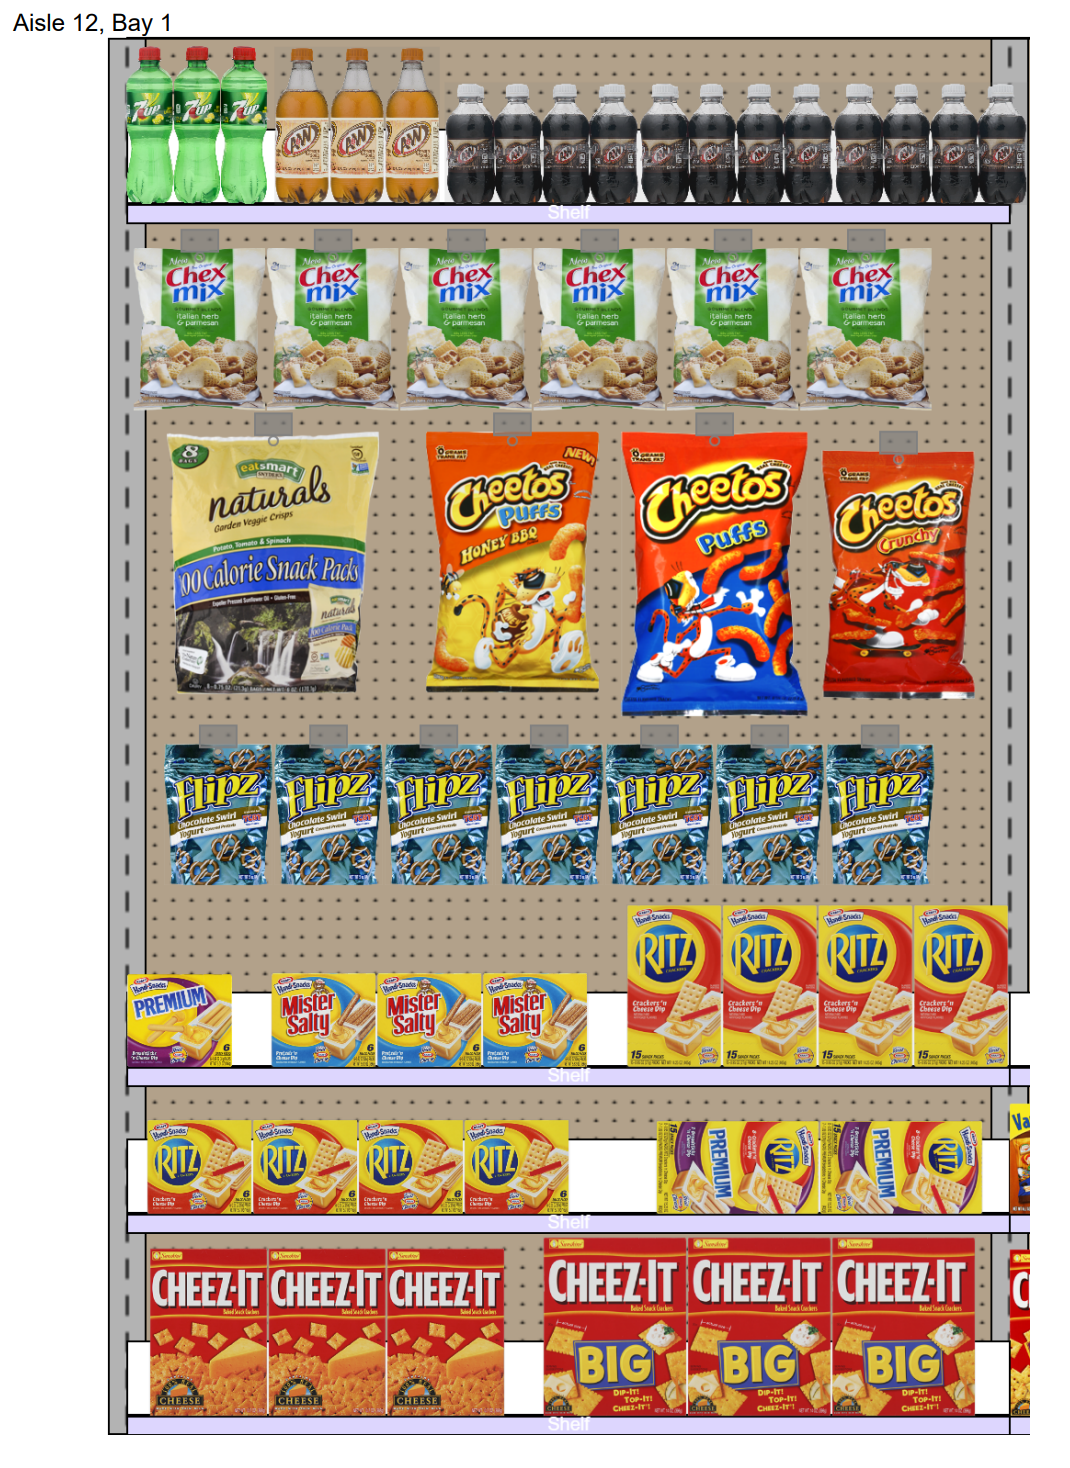
Drag and drop products from your catalog onto your fixtures. Change product orientations, add facings, or perform layouts, all with a few clicks.
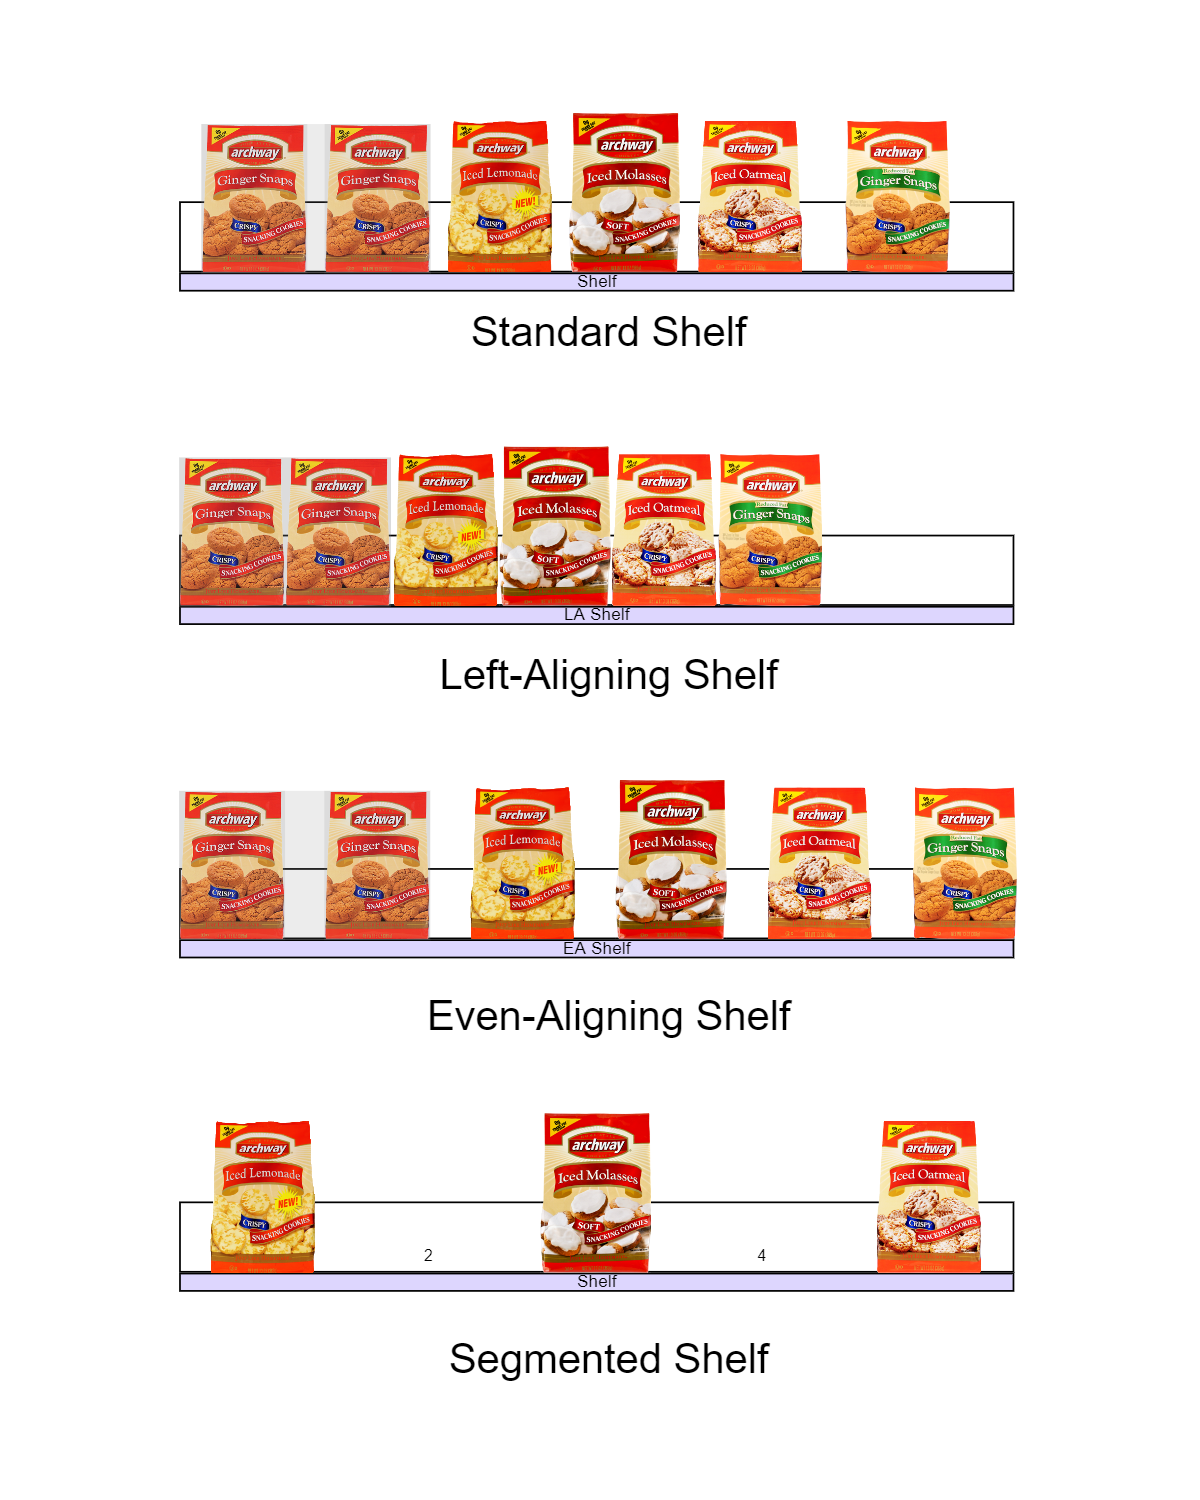
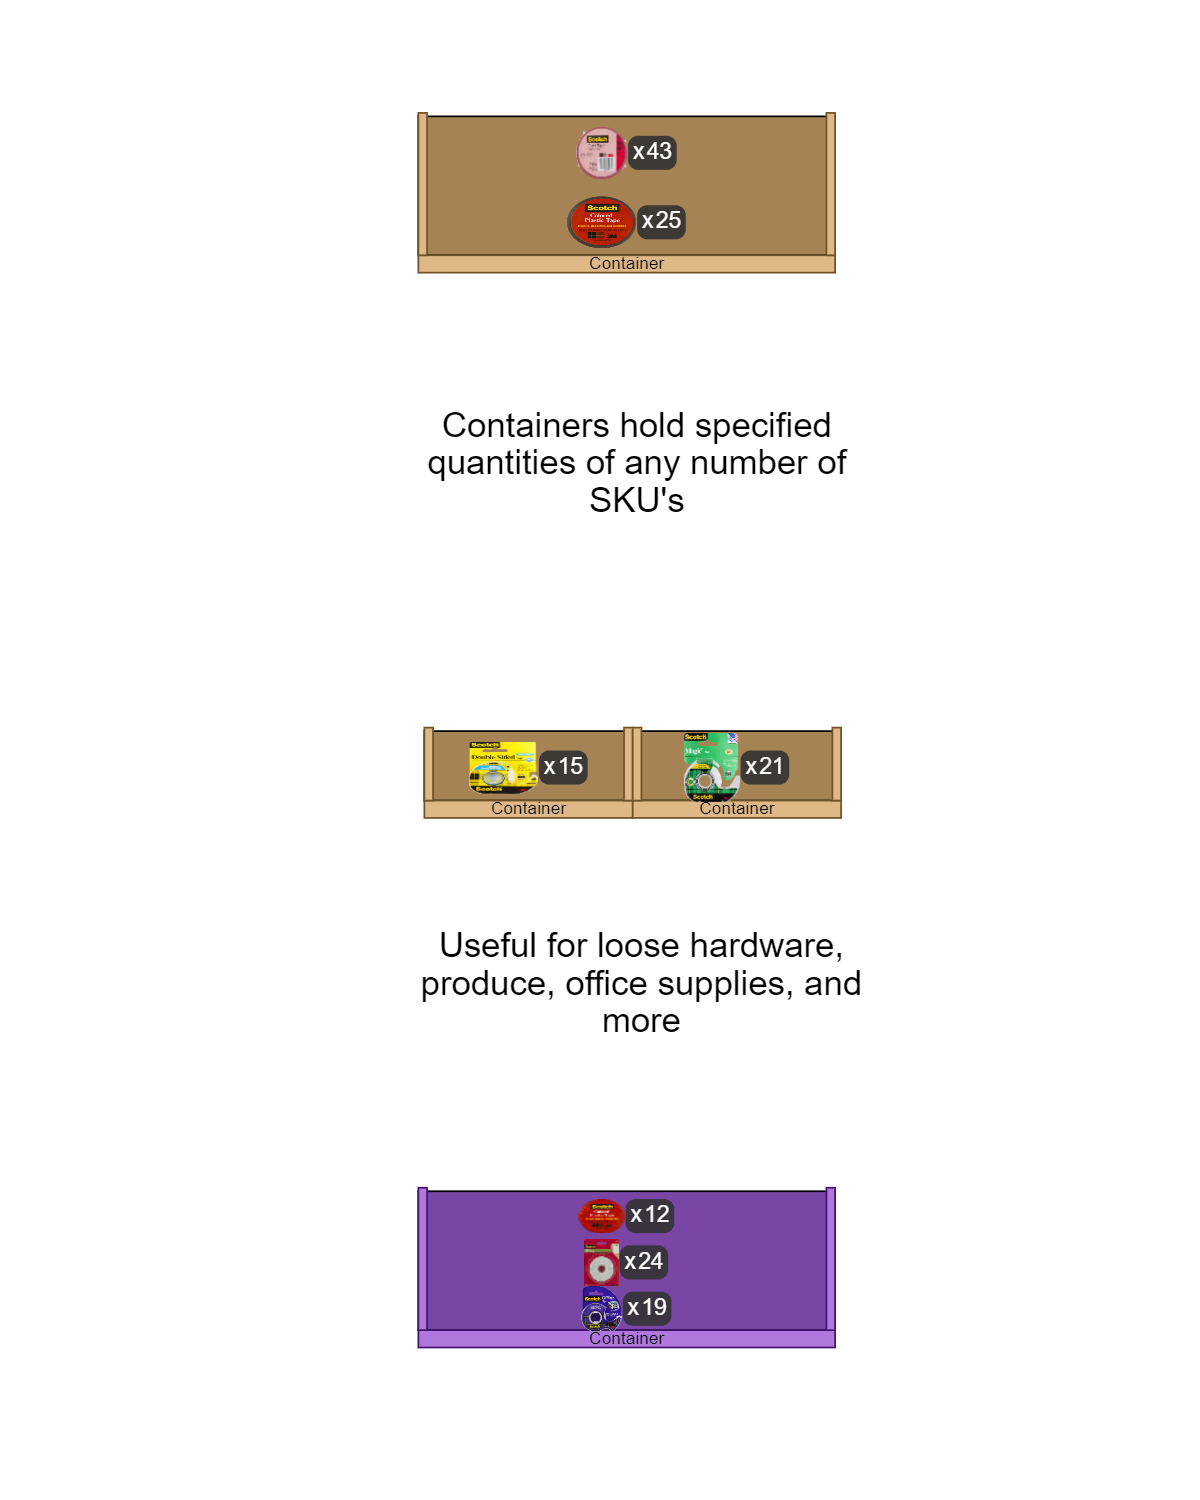
Create and configure various fixtures to hold products. Add shelves to them, including automatic left and even-aligning shelves, and segmented shelves.
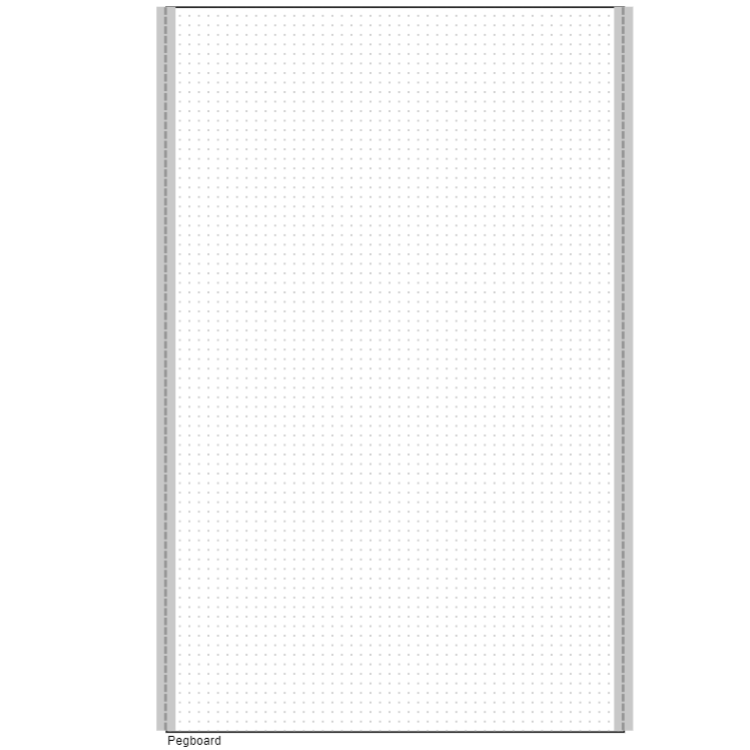
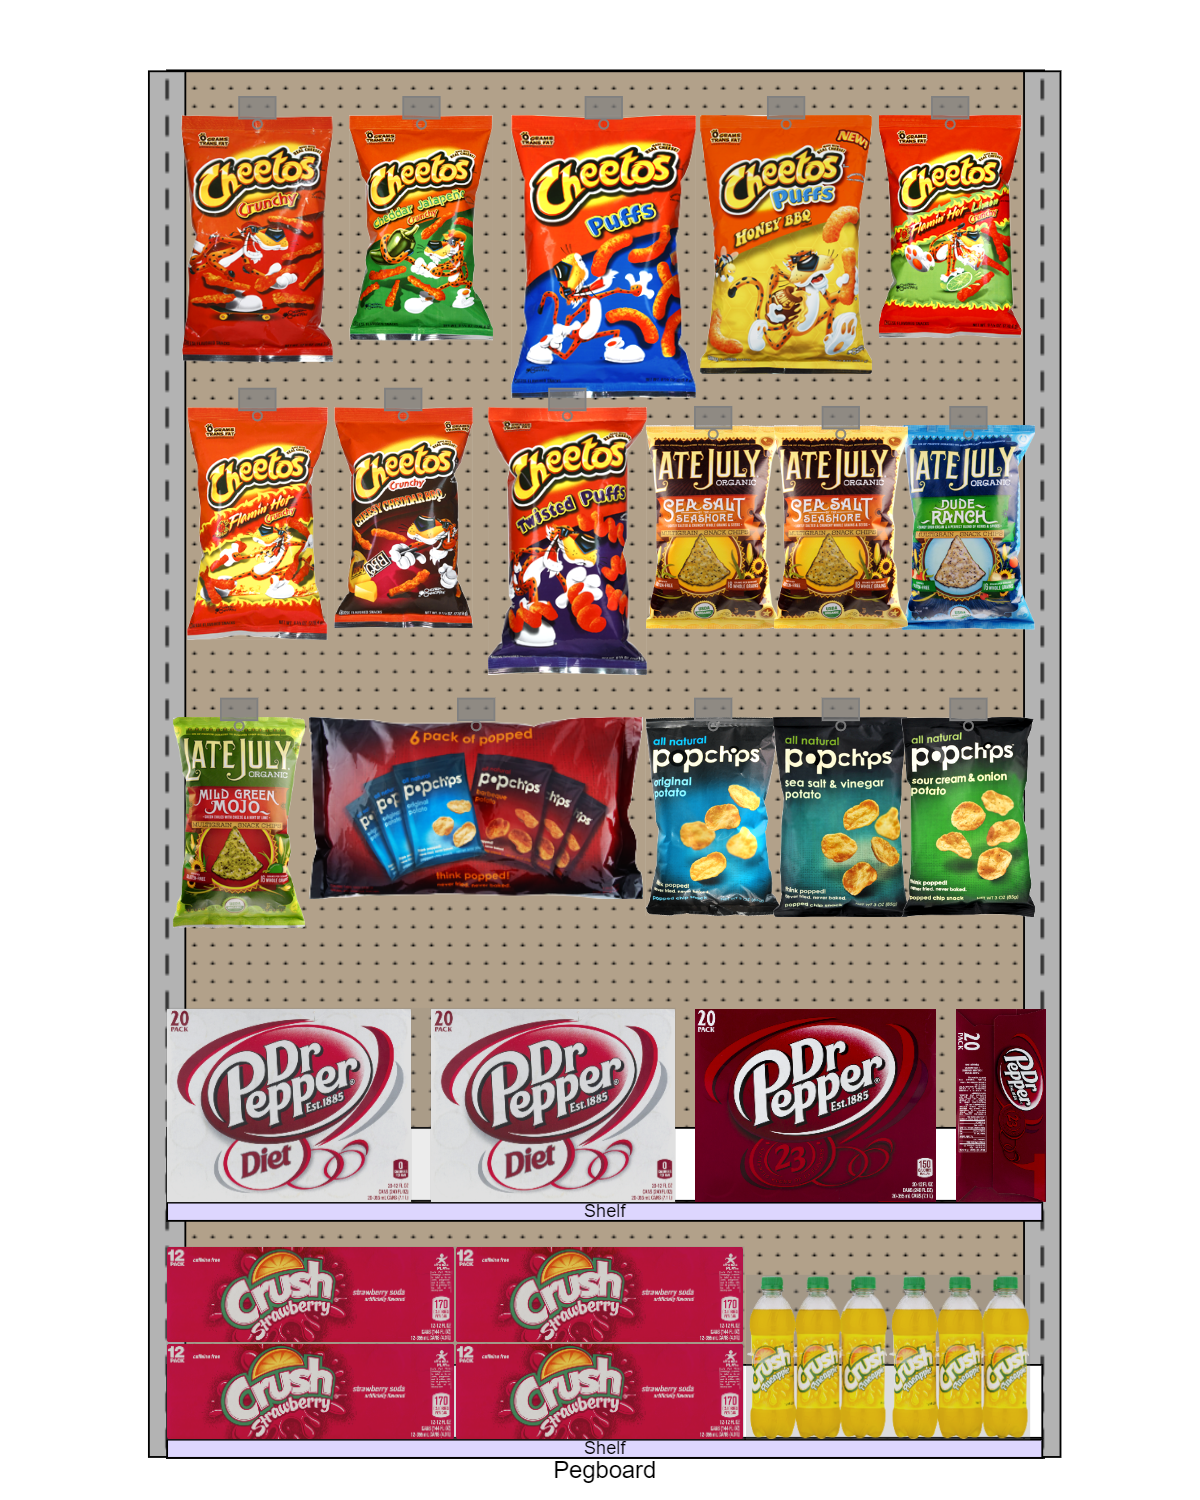
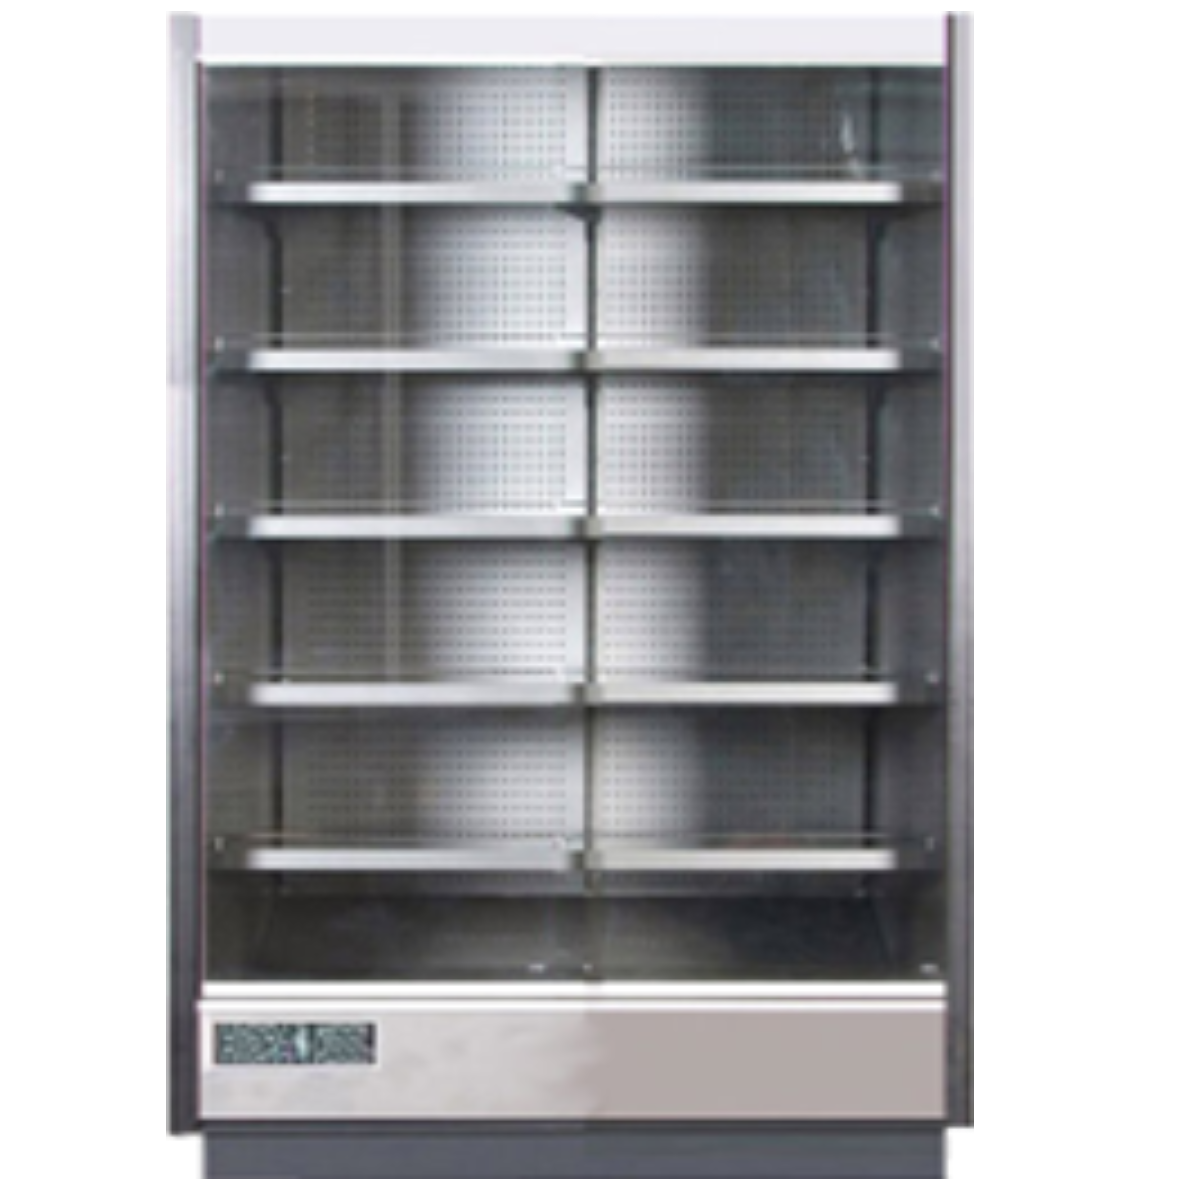
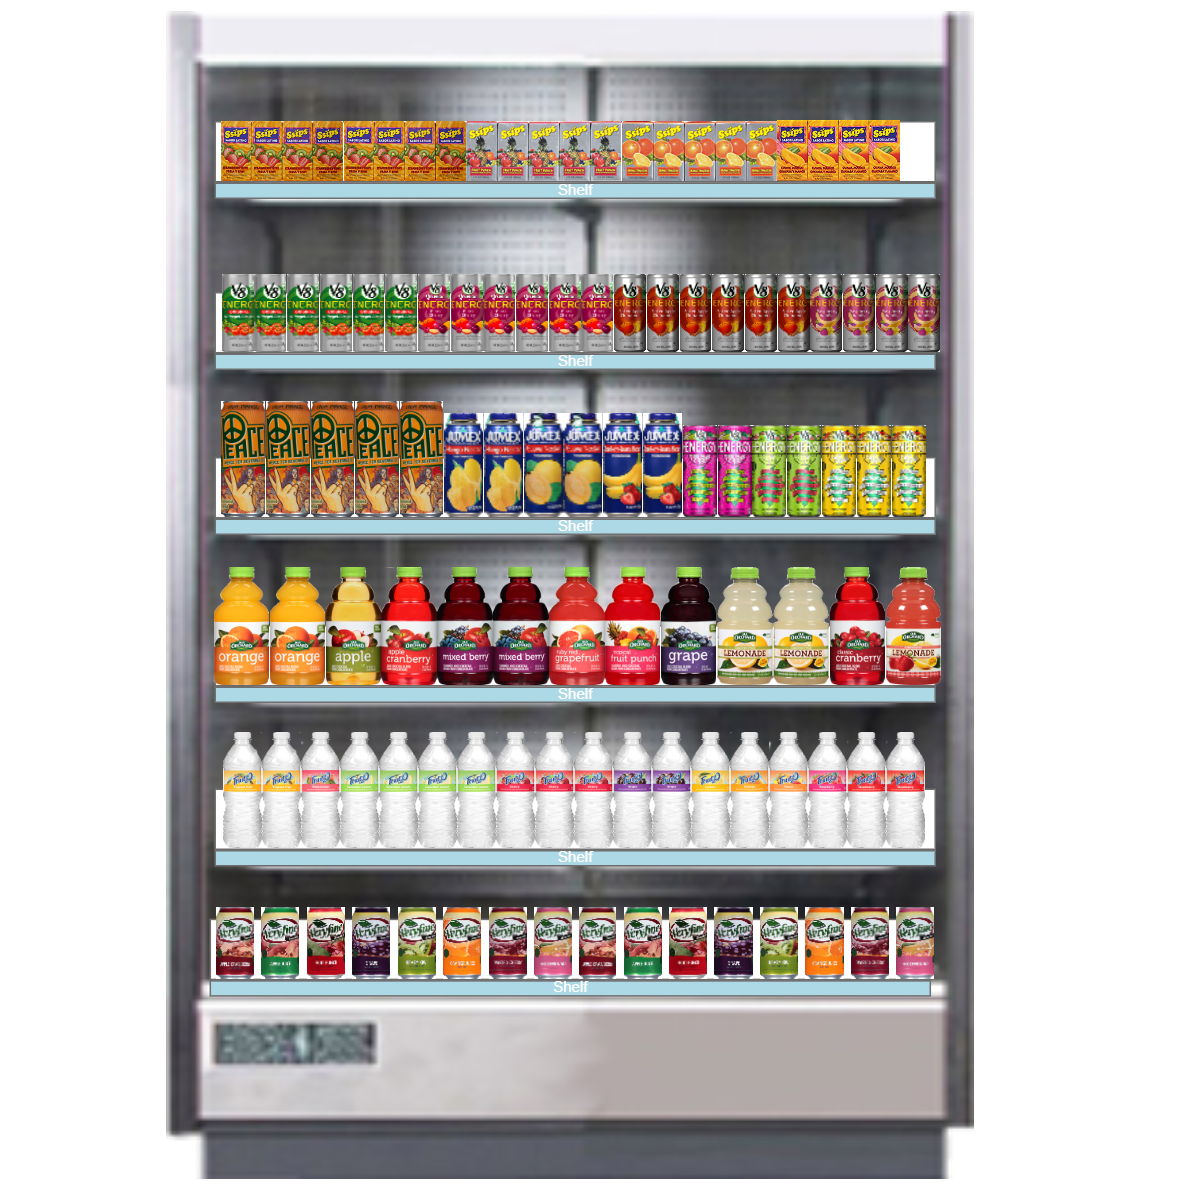
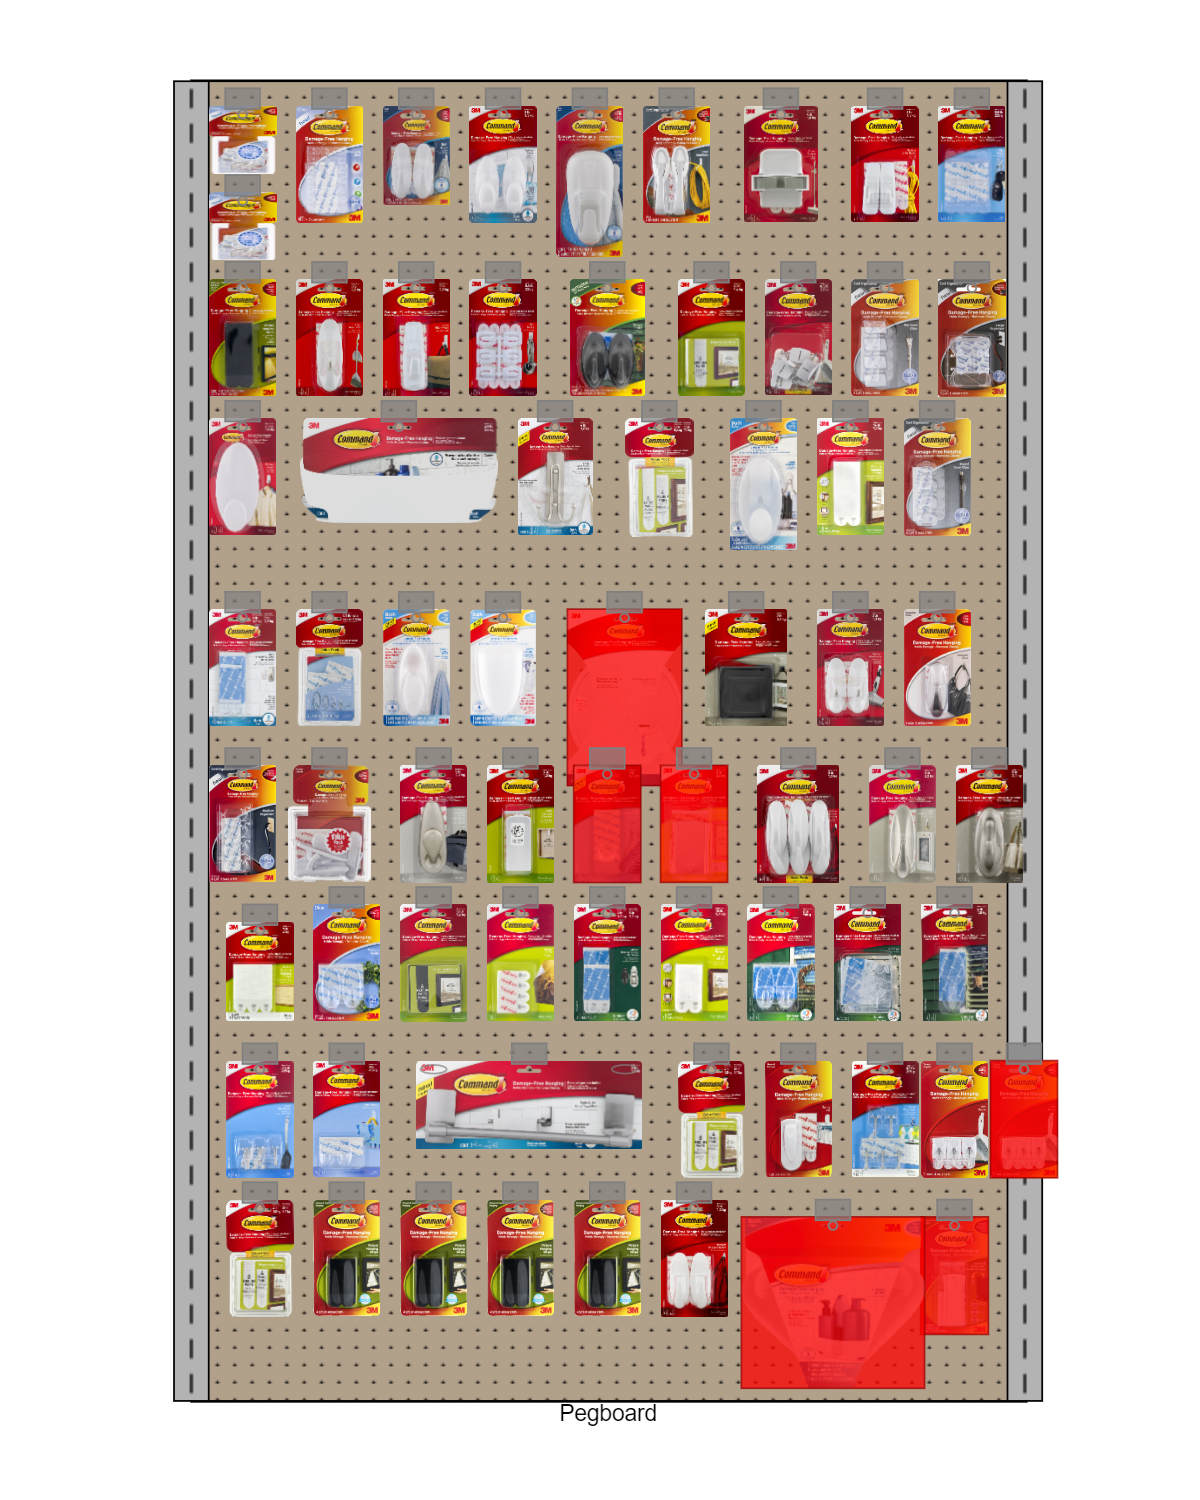
Turn any picture into Custom Fixture, such as a cooler, point of sale, or vending machine. Product snapping behaviors curated for each fixture type. Backer image support for pegboards and signs.
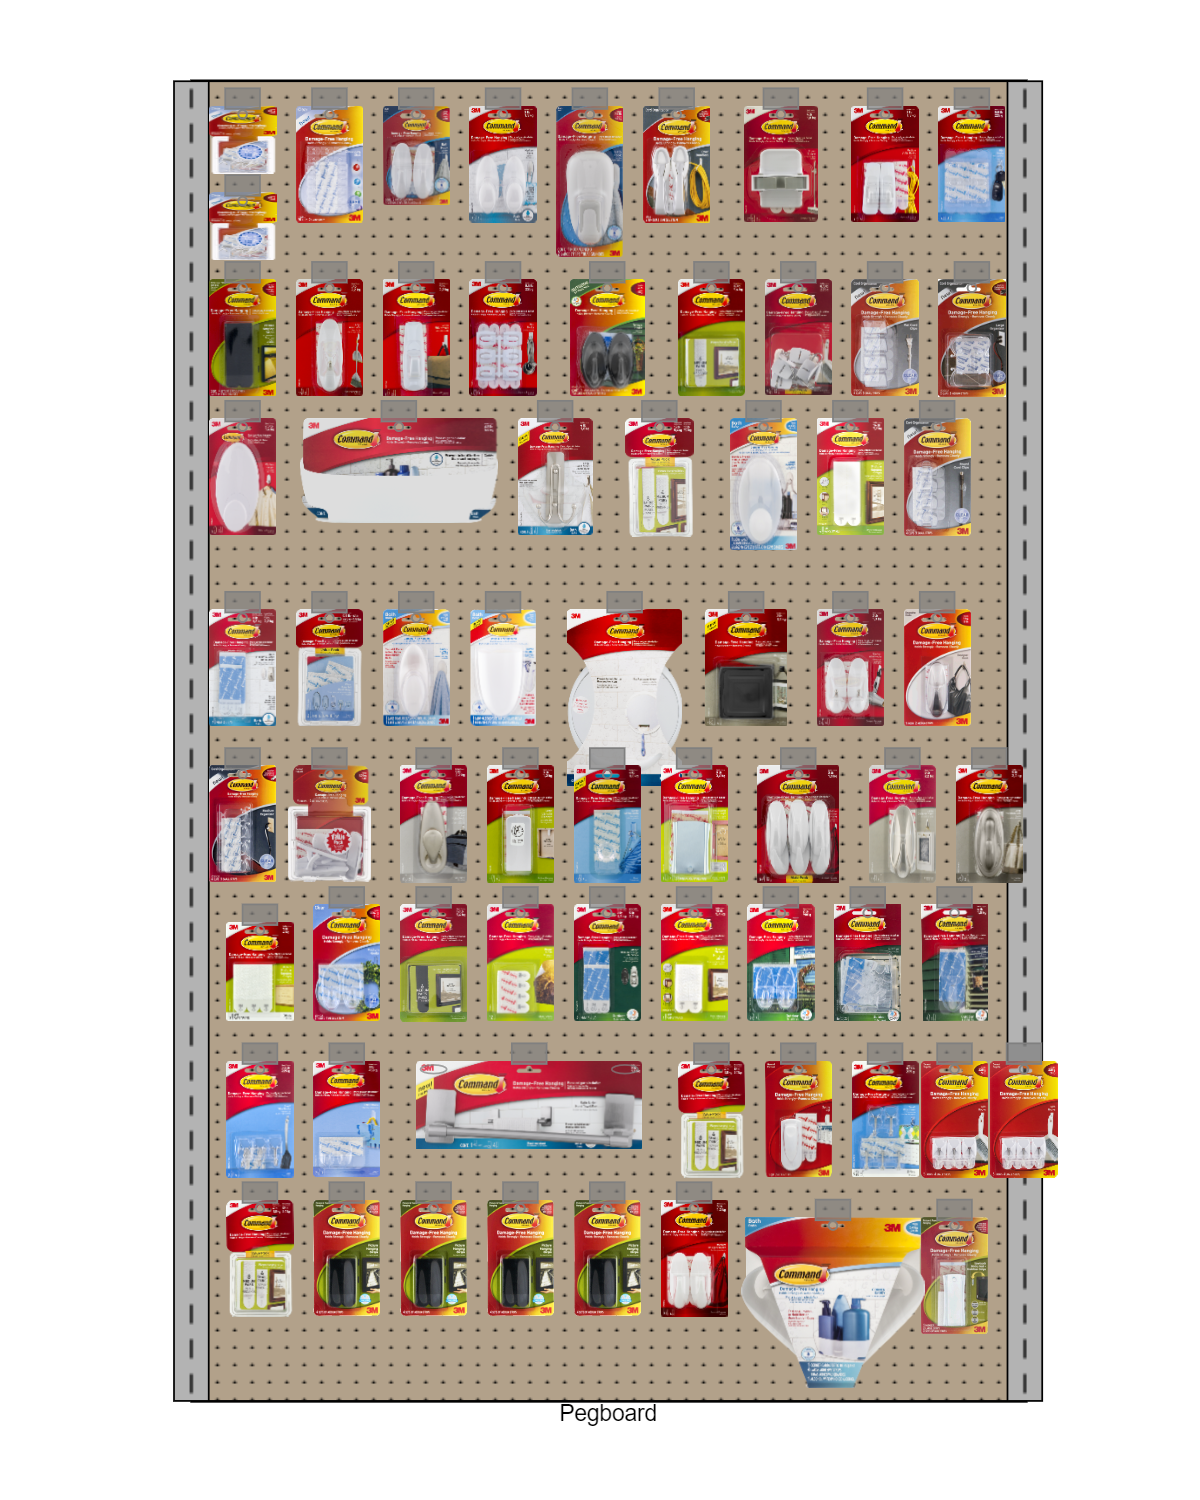
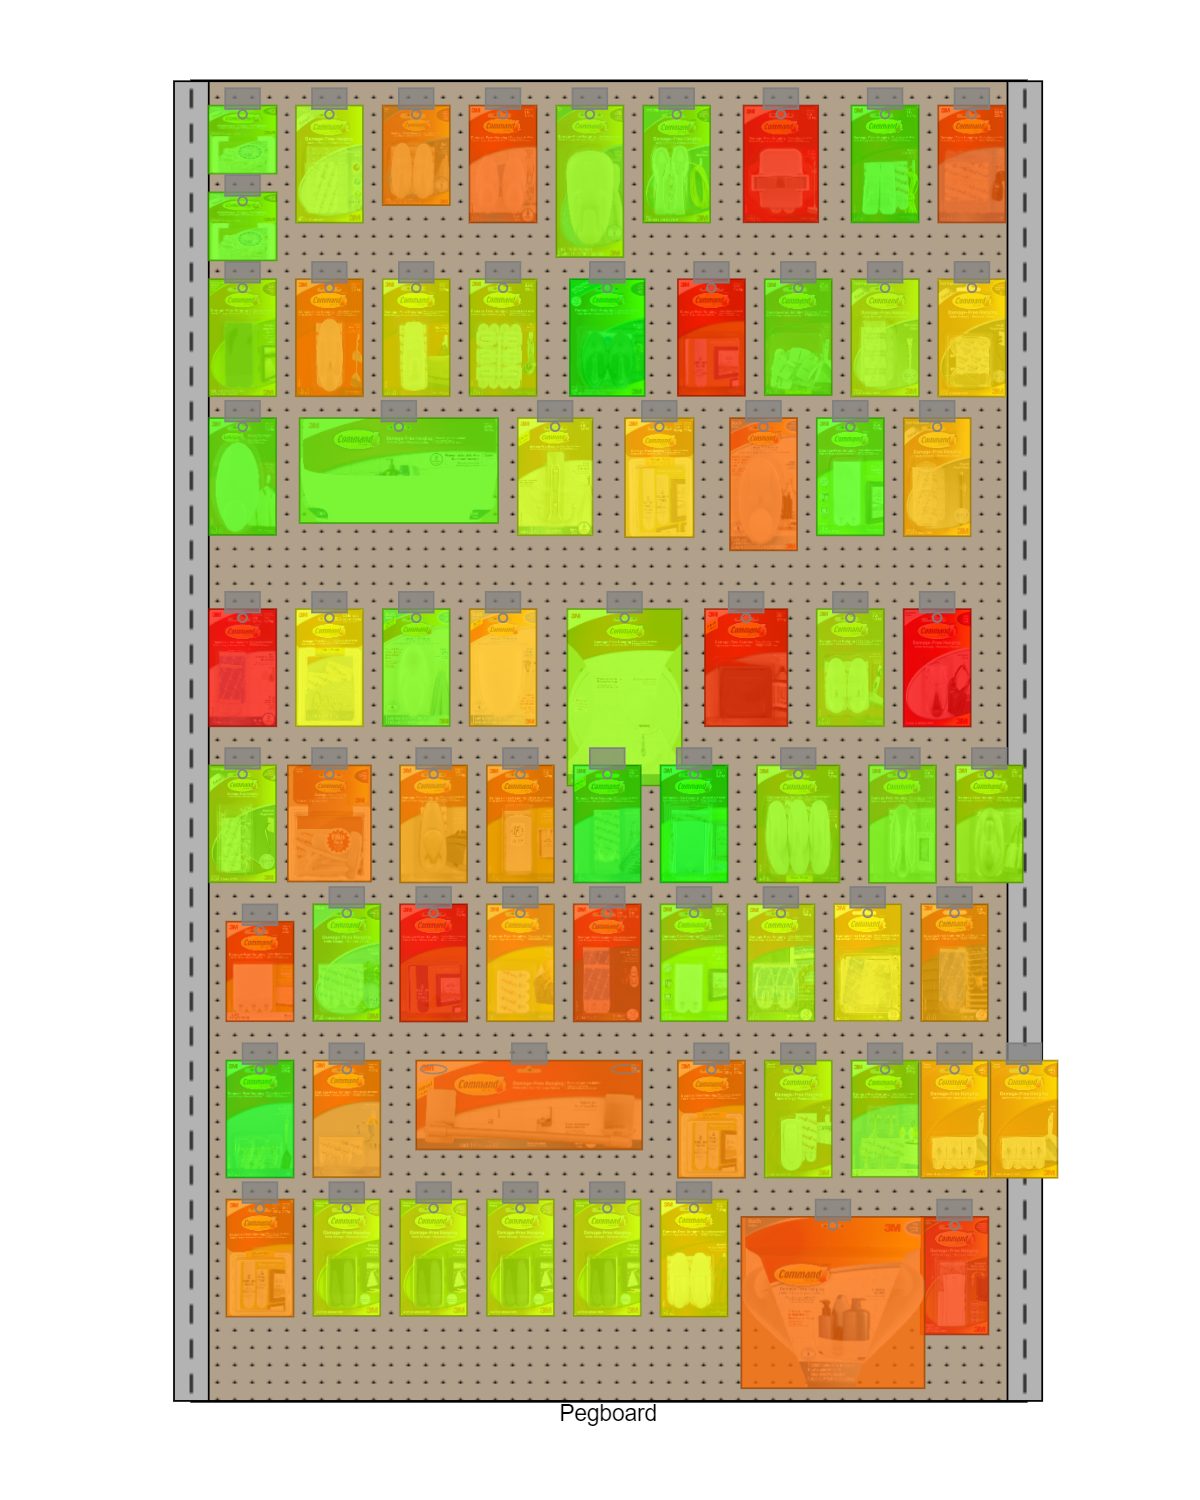
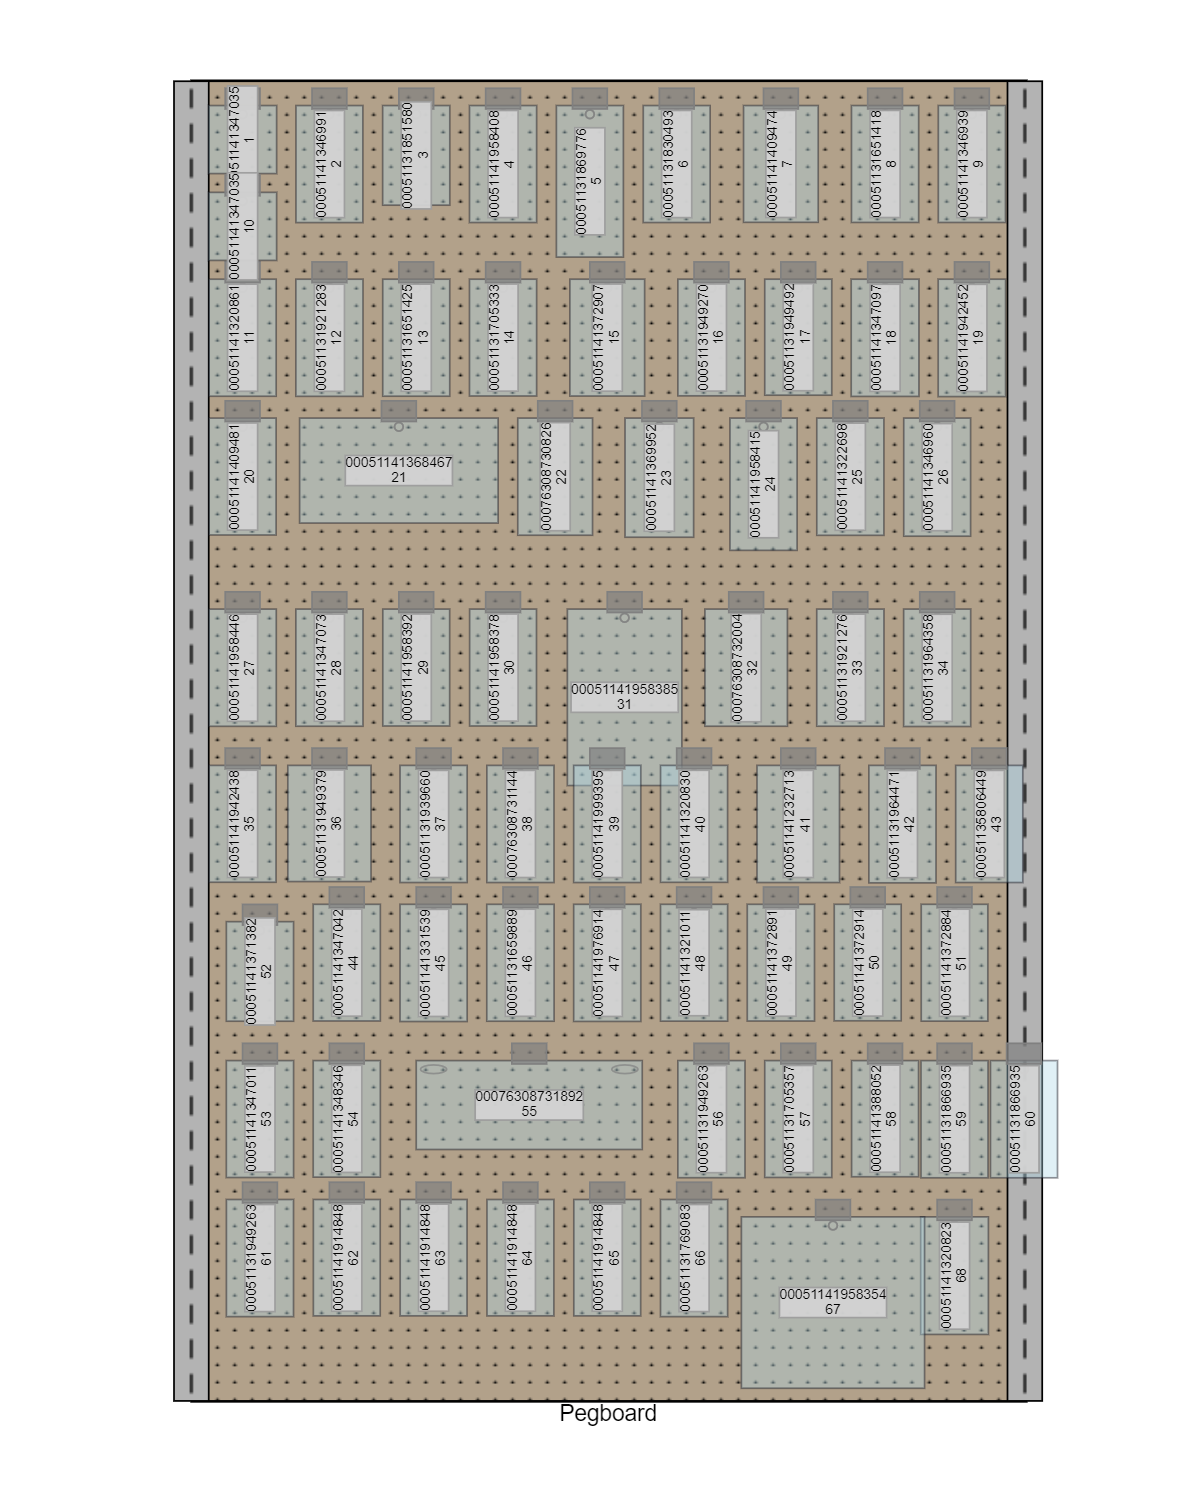
Perfect your displays with numerous analysis views, like customizable product labels and heatmaps, overlapping products, categories, orientations, and duplicates.
Visualize and assess global catalog-level data, dynamic data, or even per-planogram / store data.
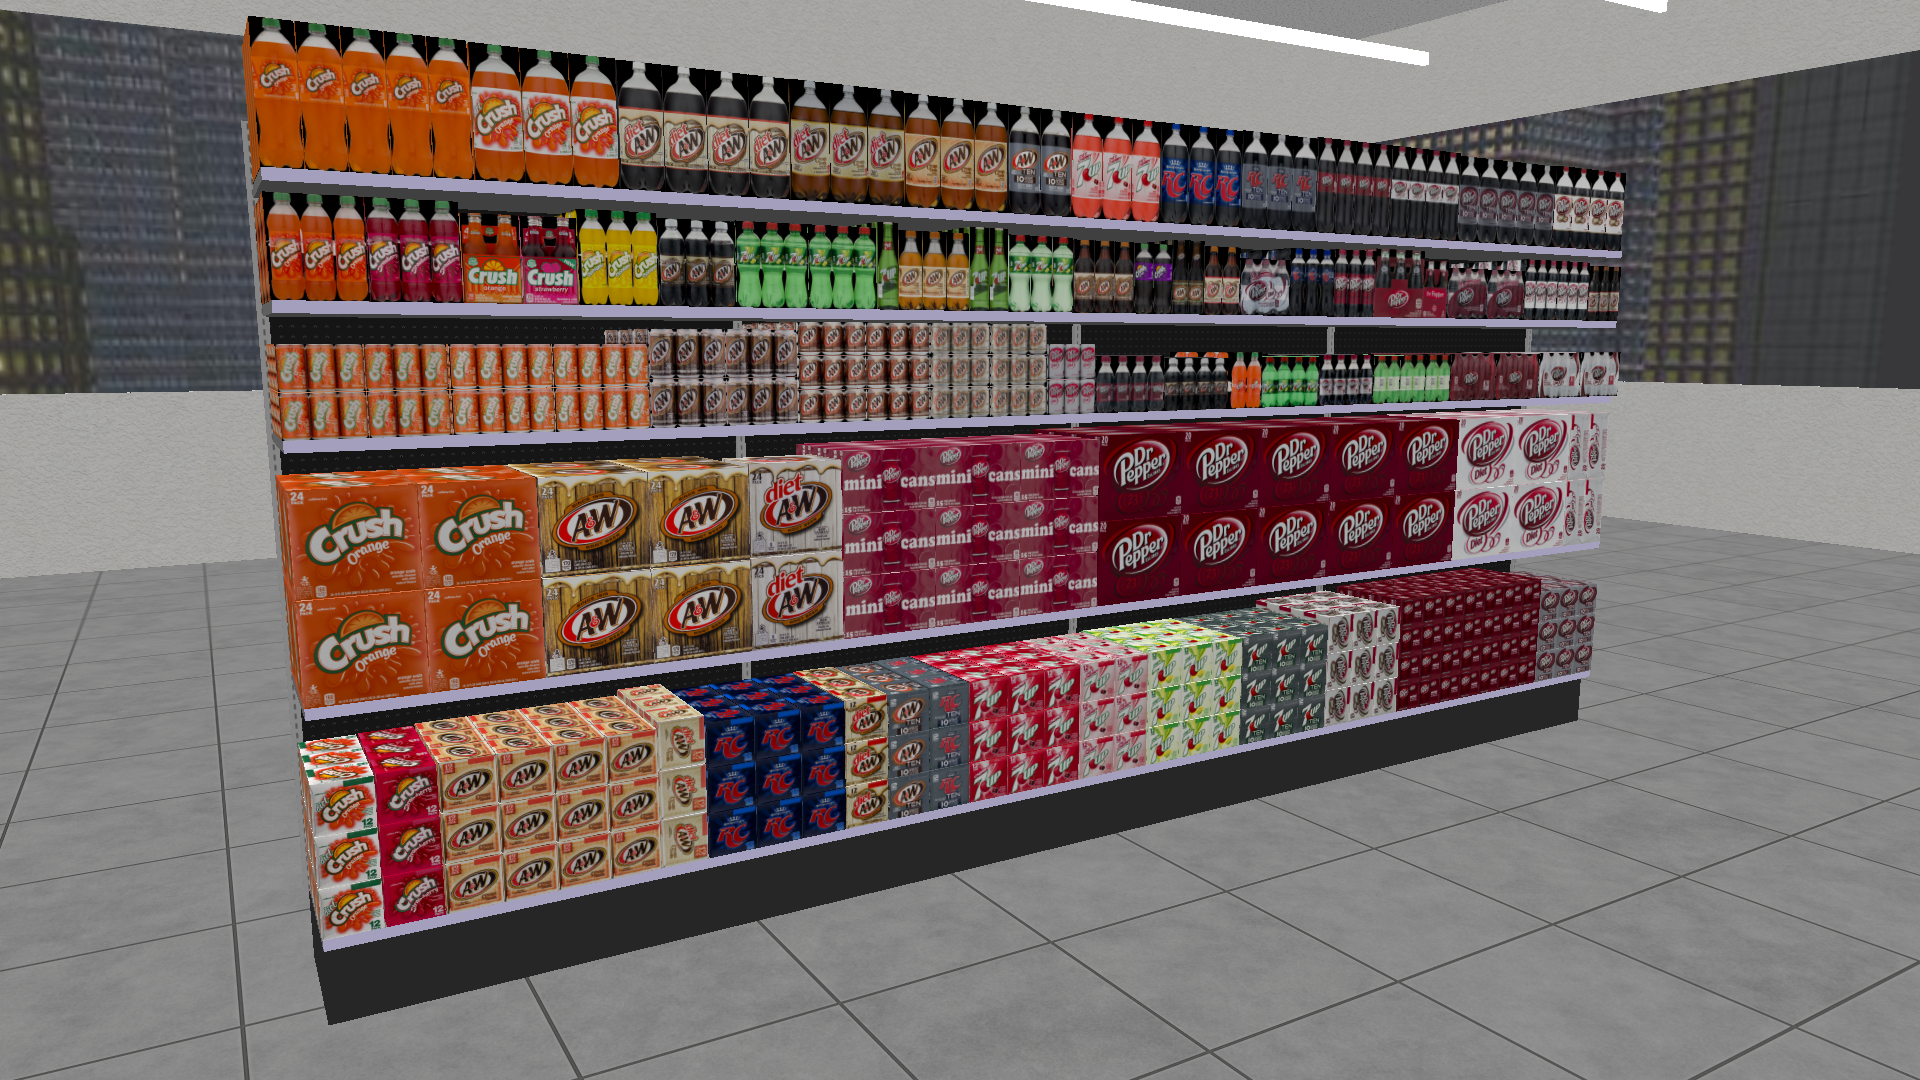
Render your floorplans and displays in real-time 3D, to impress clients or ensure merchandising perfection from every angle. Walk through your store and look around freely, or jump between fixed camera positions you define in floorplan mode.
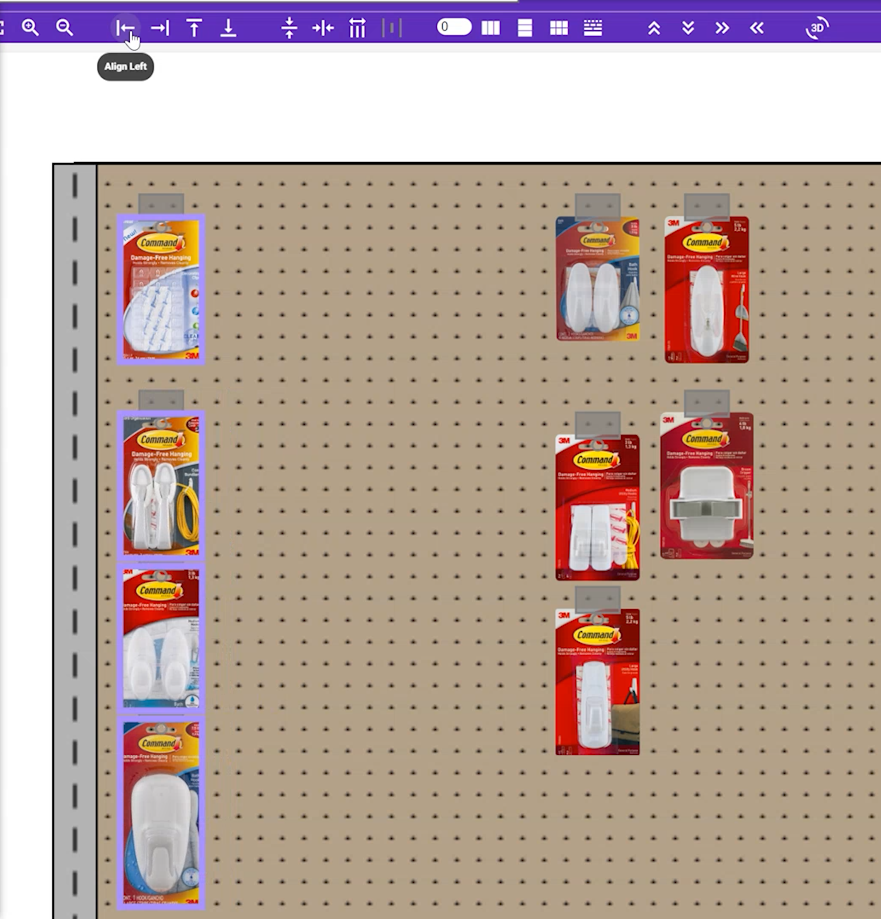
Align products across shelves, racks, or even relative to one another, with a single click. Products snap according to fixture rules with the spacing you set, and never create overlaps.
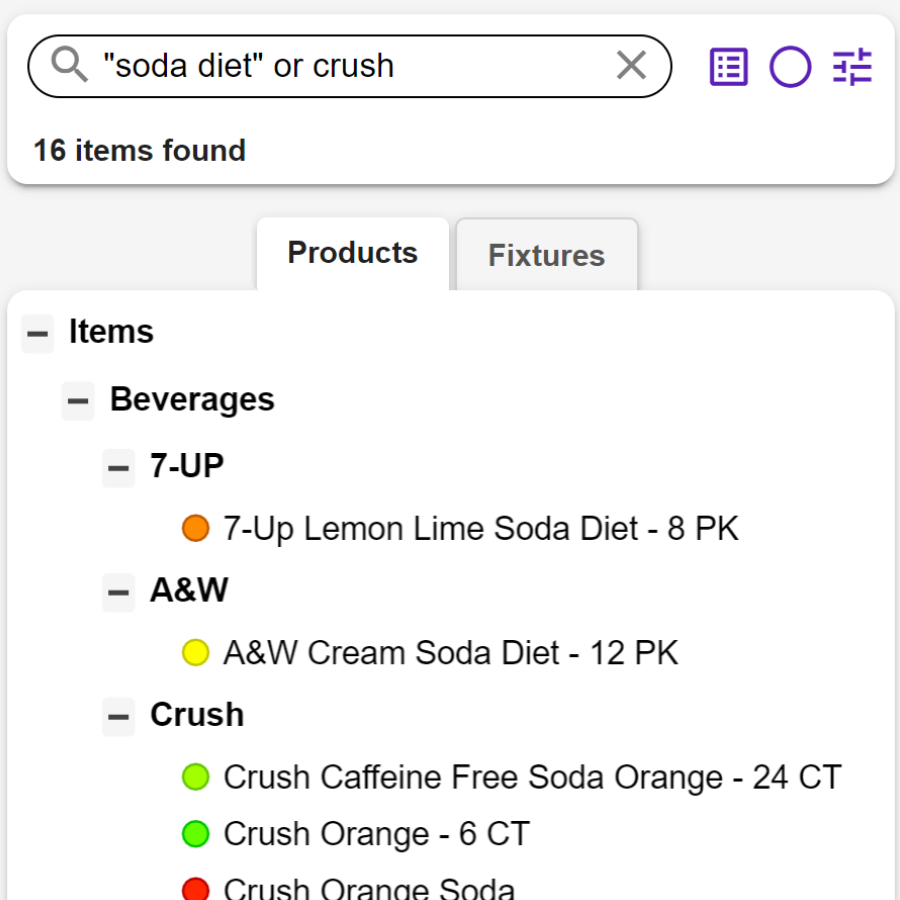
Manage tens of thousands of your products with fully customizable filters, sorting, search terms, distributor accounts, and product assortments, so you can work with just the SKU's you want.
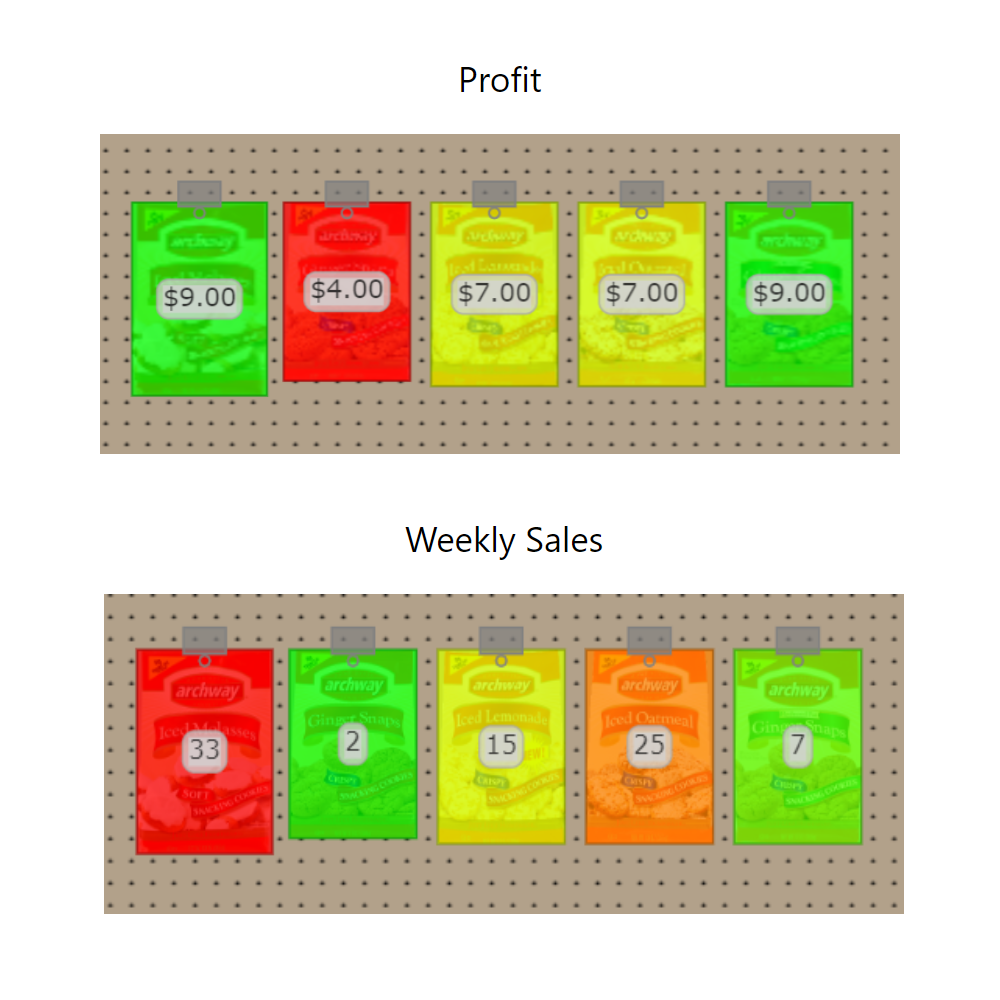
Make your data work for you. Define custom heatmaps, labels, report properties, filters, tags, and so much more, as functions of your product and sales data.
Compatible with virtually all modern browsers, including Chrome, Firefox, Edge, and Safari
Server hosted by Amazon AWS, the leader in cloud services
Planogram data consolidated on server, for ease of data mining, category management, and more
24/7 worldwide access on tablets, smartphones (Android and iOS), Chromebooks, Windows, and Mac
Nothing to install. All users instantly get the latest features
Employees worldwide can easily share designs, encouraging collaboration and reuse
Planograms are stored in the cloud - no worries about local PC crashes, backups, or other loss of data
Nightly backups of planogram data, product data, and product images
Most recent 30 days of backups retained
Share best-in-class planograms with all your users, which they can use as starting points for their own displays.
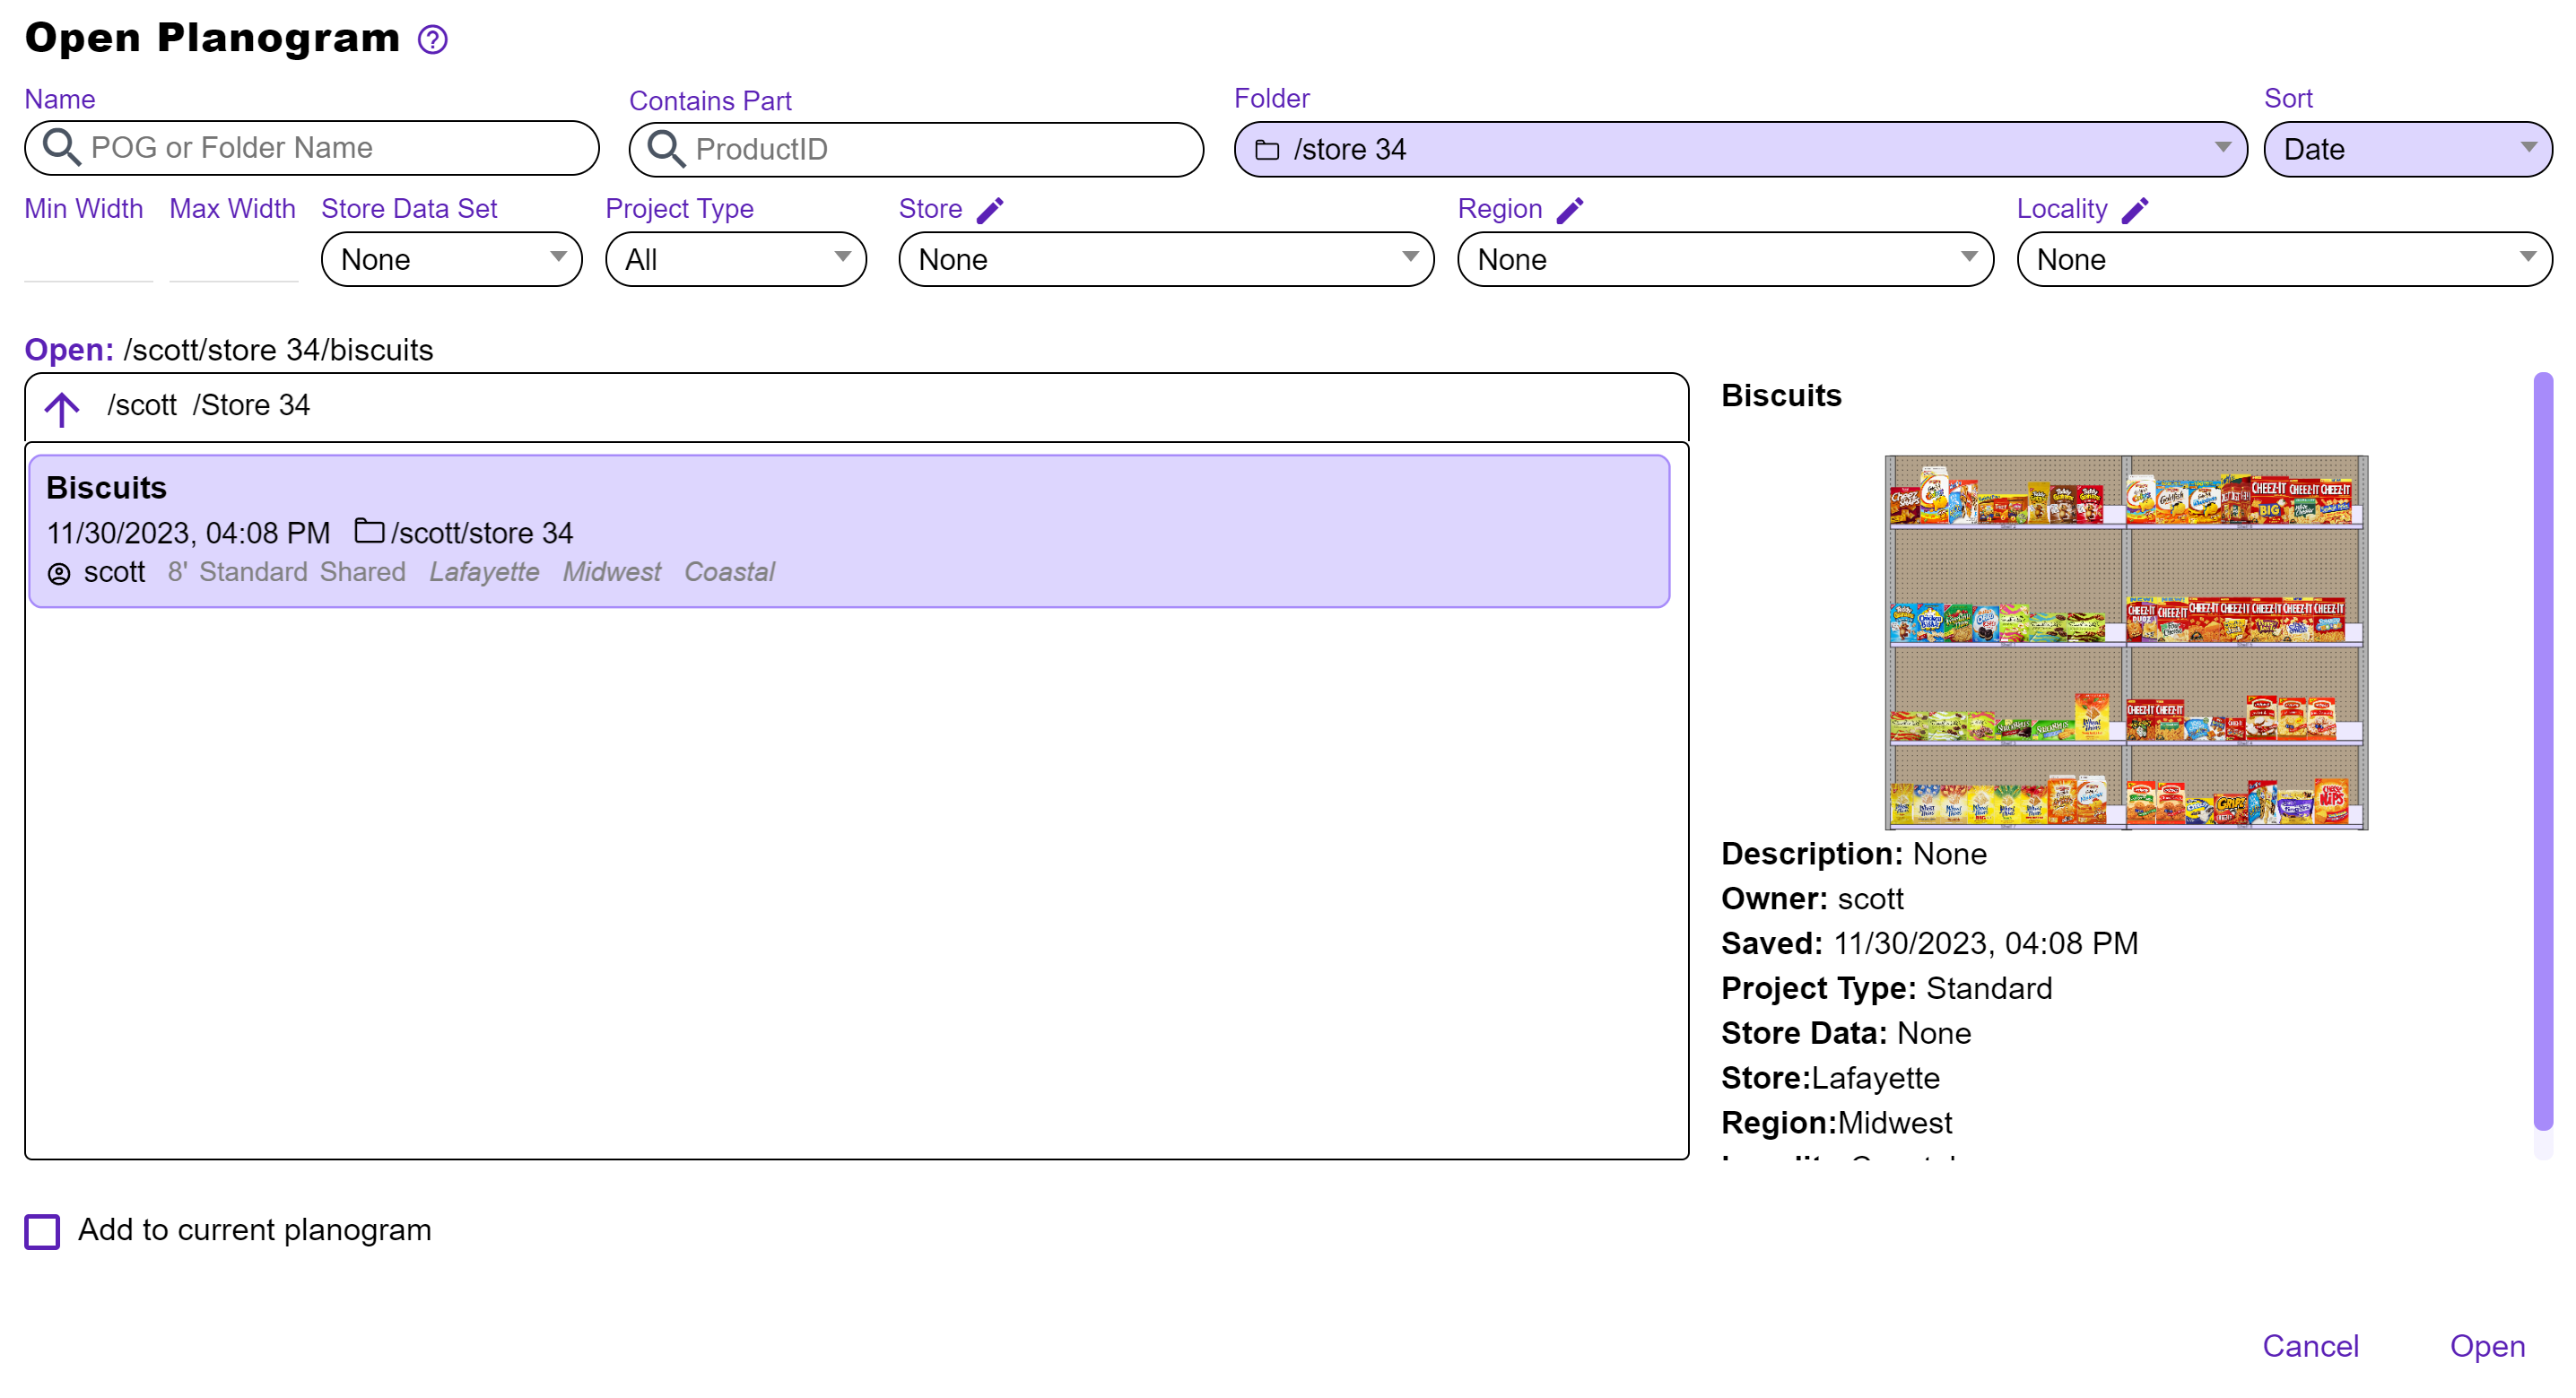
Find the exact planograms you're looking for: filter by search term, Product ID, creator, custom tags, project type, and total rack width.
Organize saved planograms with a robust folder filesystem.
Save commonly-used product groups and compound fixtures as reusable building blocks for all your users.
Import / Export JDA/BlueYonder .PSA files.
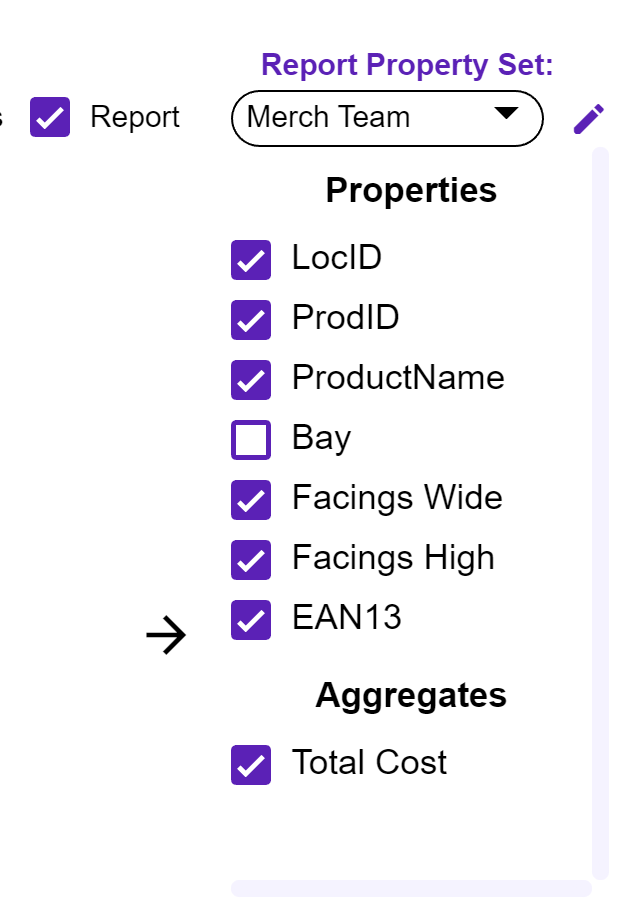
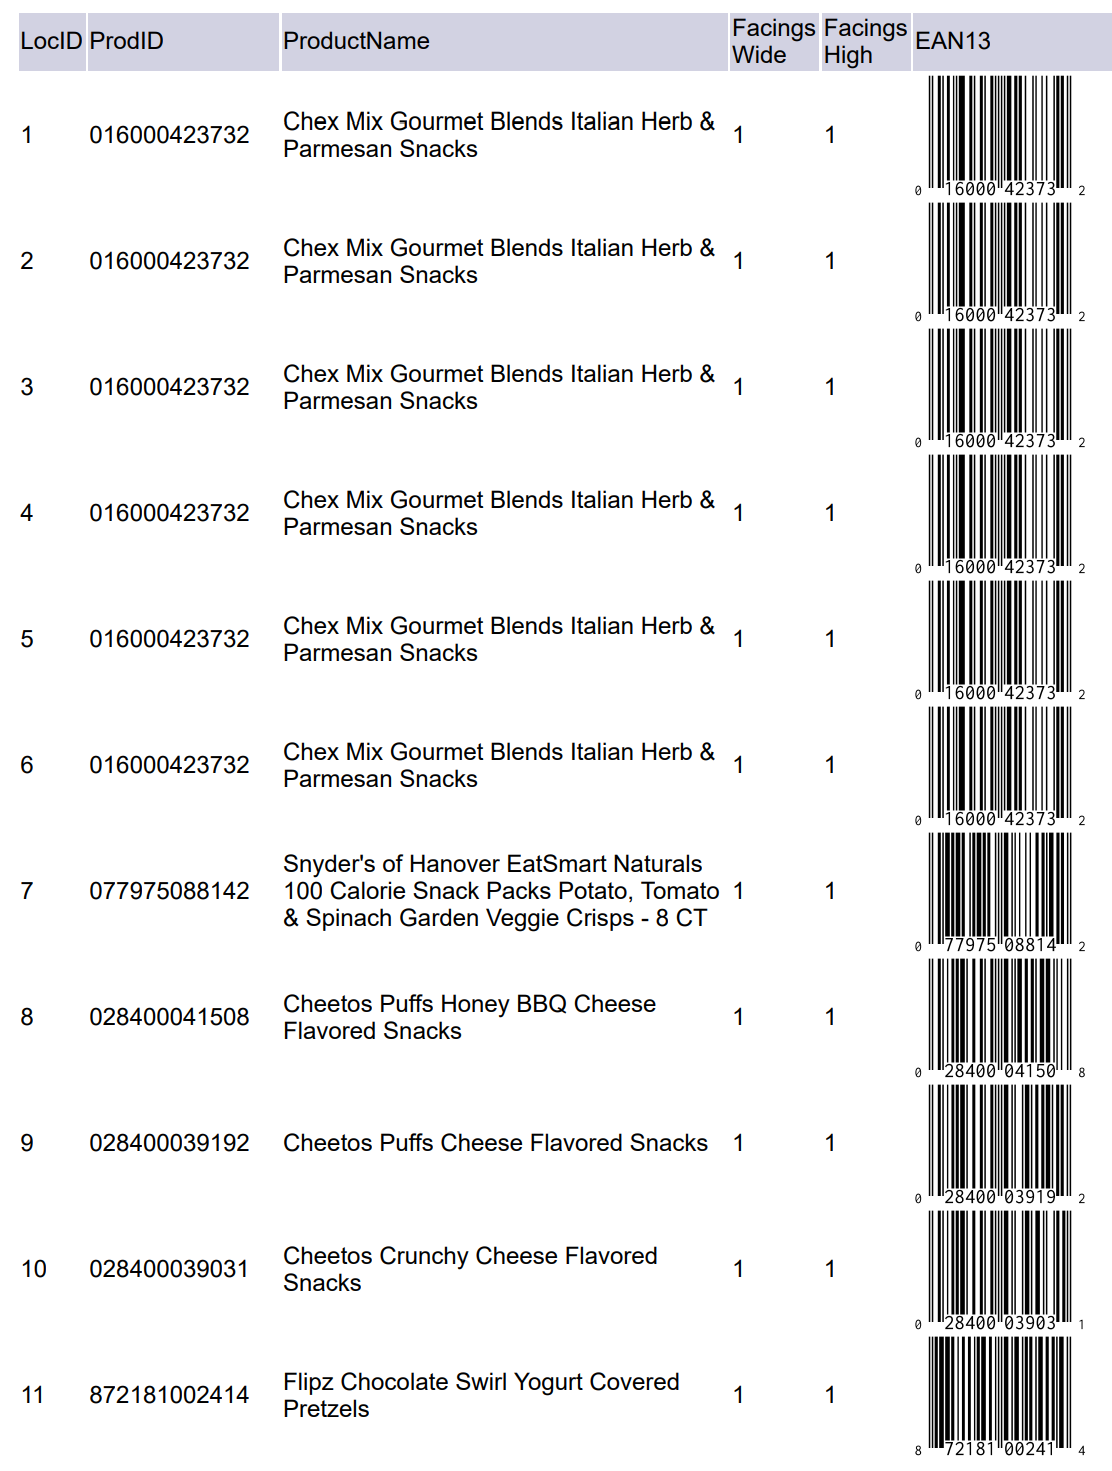
Generate planogram reports as CSV, XLSX, or Google Sheets files. These include data about the products in your planogram and aggregates, such as total number of peghooks, or the average best-selling value of the products in the display.
The reported data and aggregates are fully customizable, and extremely versatile. You can report data properties already included in your product data (including your own custom data fields, beyond what GoPlanogram automatically supports). Additionally, you can use powerful, Excel-like calculations to include any metric you need, such as return on investment, average sales, or total weight.
Print Planograms or save PDF file. Save image of planogram as .PNG files to disk or Google Drive.
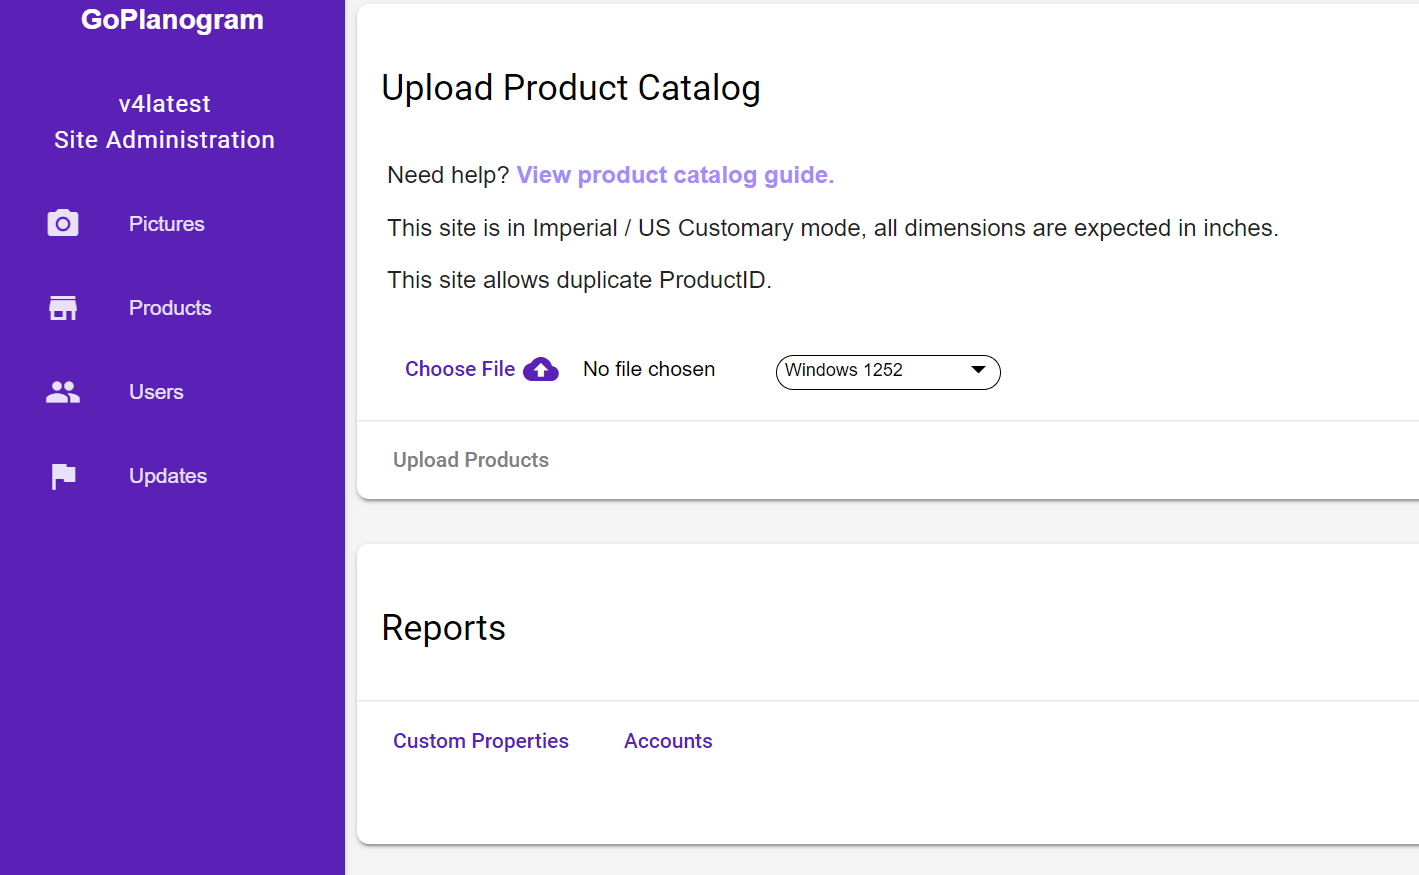
Easy to use Admin Pages for uploading new product data and pictures
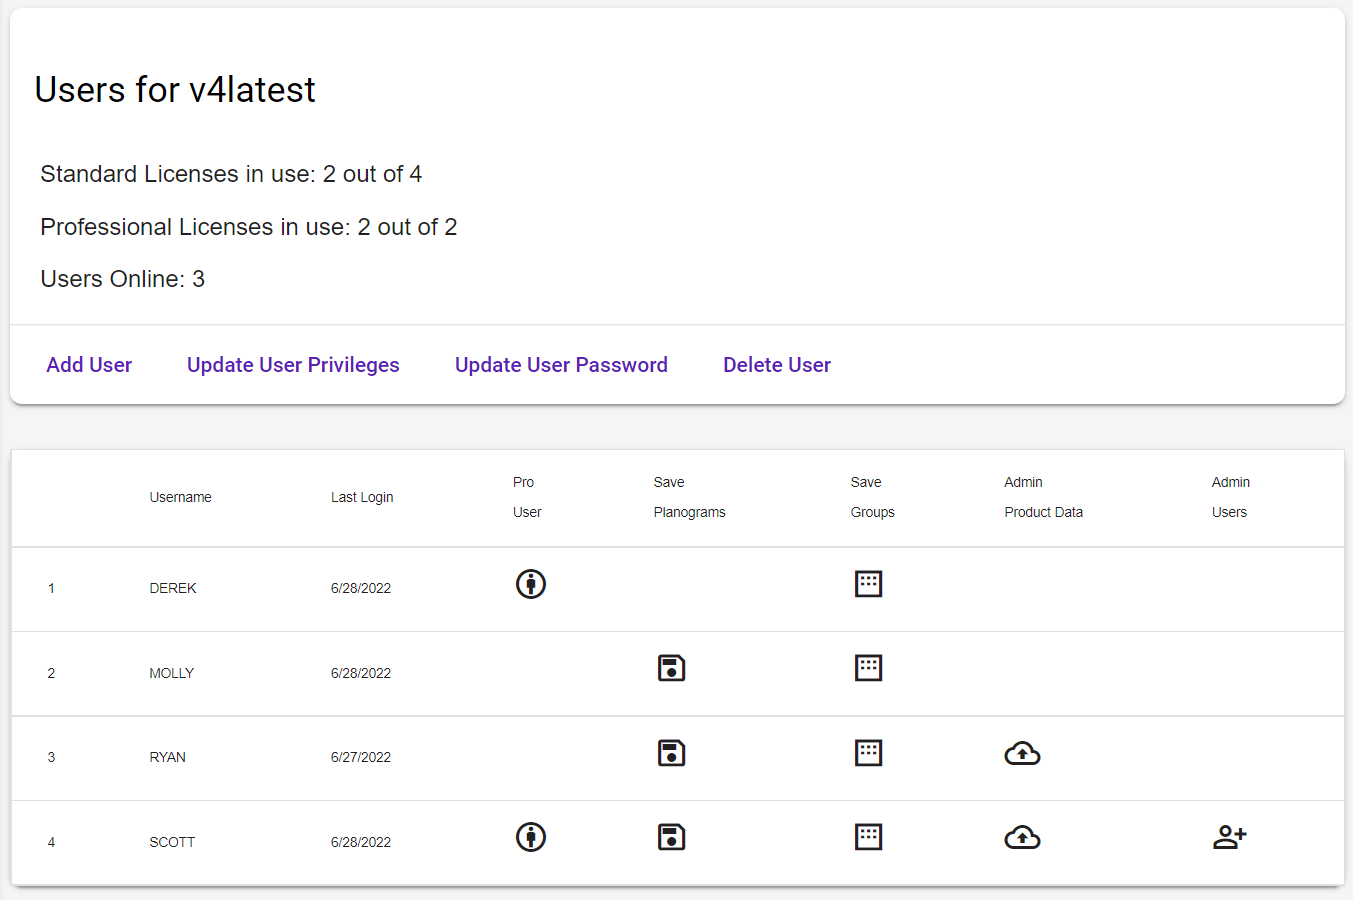
User management console for creating and updating users and their privilege levels
Image validation - automatically identify missing product pictures
Compress/resize product pictures to appropriate size automatically